Call Performance Dashboard
Call Performance Dashboard Overview
- The Call Performance Dashboard provides a detailed view of call-related KPIs (Key Performance Indicators), allowing users to monitor and evaluate call metrics.

Getting Started with Call Performance Dashboard
- To go to Call Performance Dashboard to your Smartflo account, first log in using your unique User ID and Password. Once logged in, you will be directed to the main dashboard. From there, locate the navigation menu on the left-hand side of the screen and click on "Insights". You will land on the Insights Dashboard; from there, click on Call Performance Dashboard, which is located just to the right-hand side of the navigation menu on the top-left corner of the screen.
Note: The Call Performance Dashboard is currently in closed beta. Access may be limited to selected users or accounts.
- Date Selection
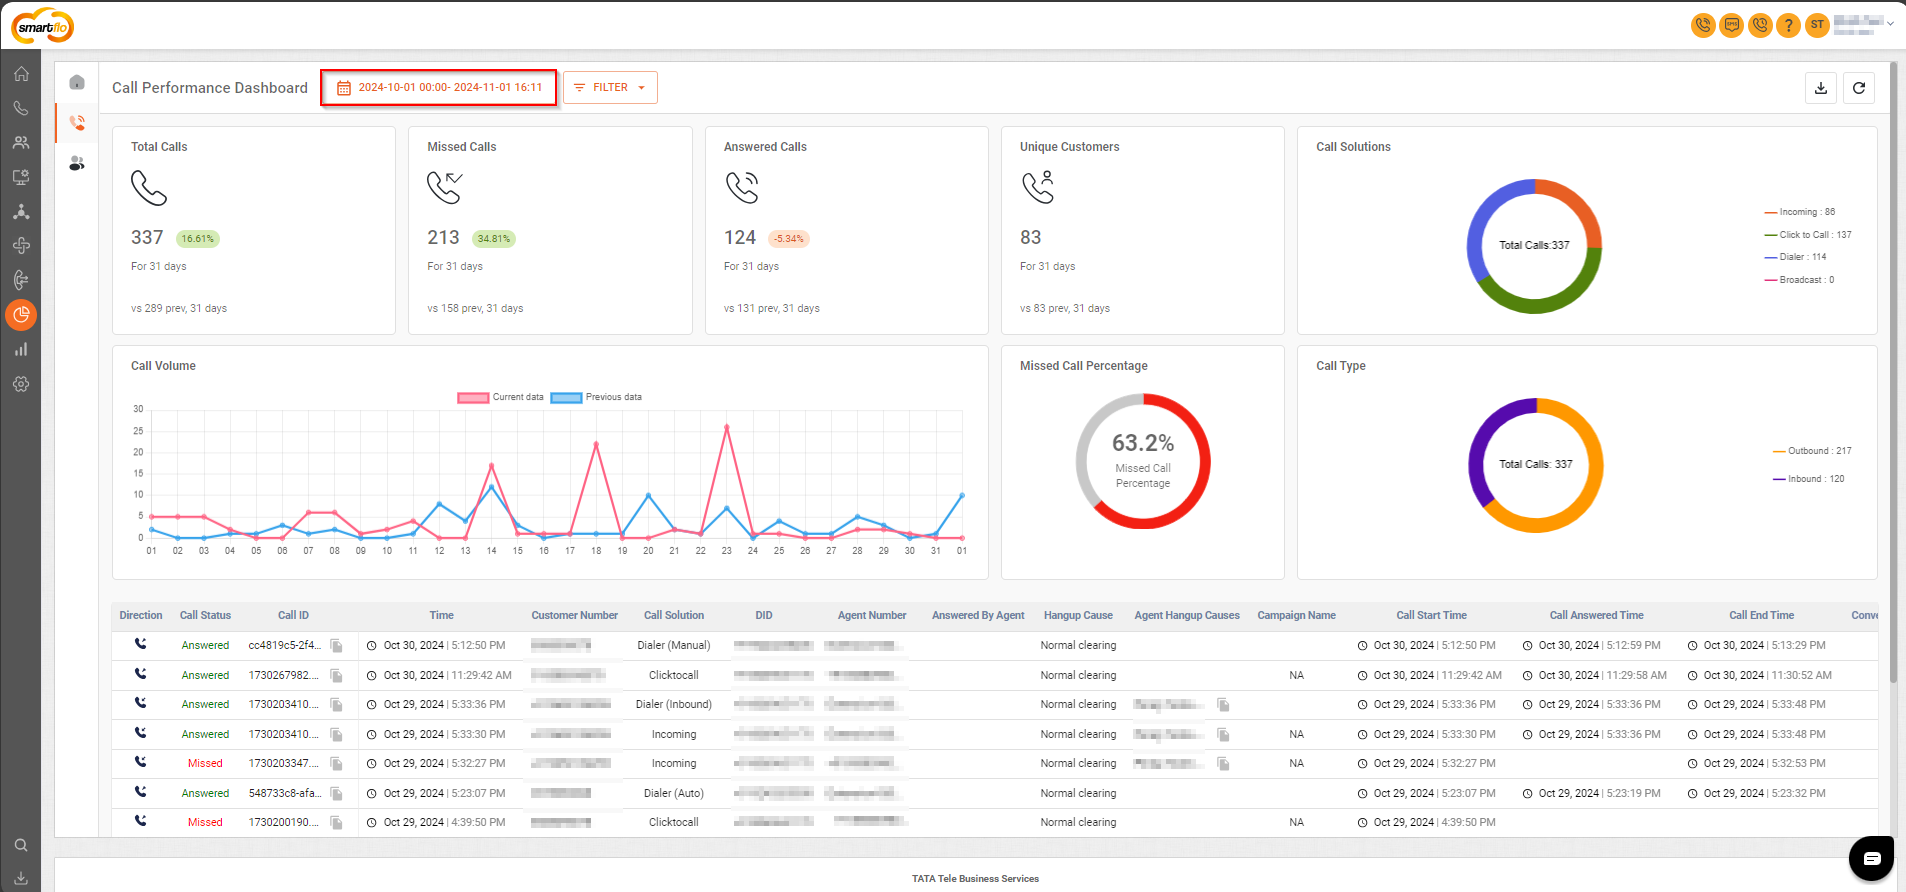
- Click on the date selection tool, as shown in the screenshot above.
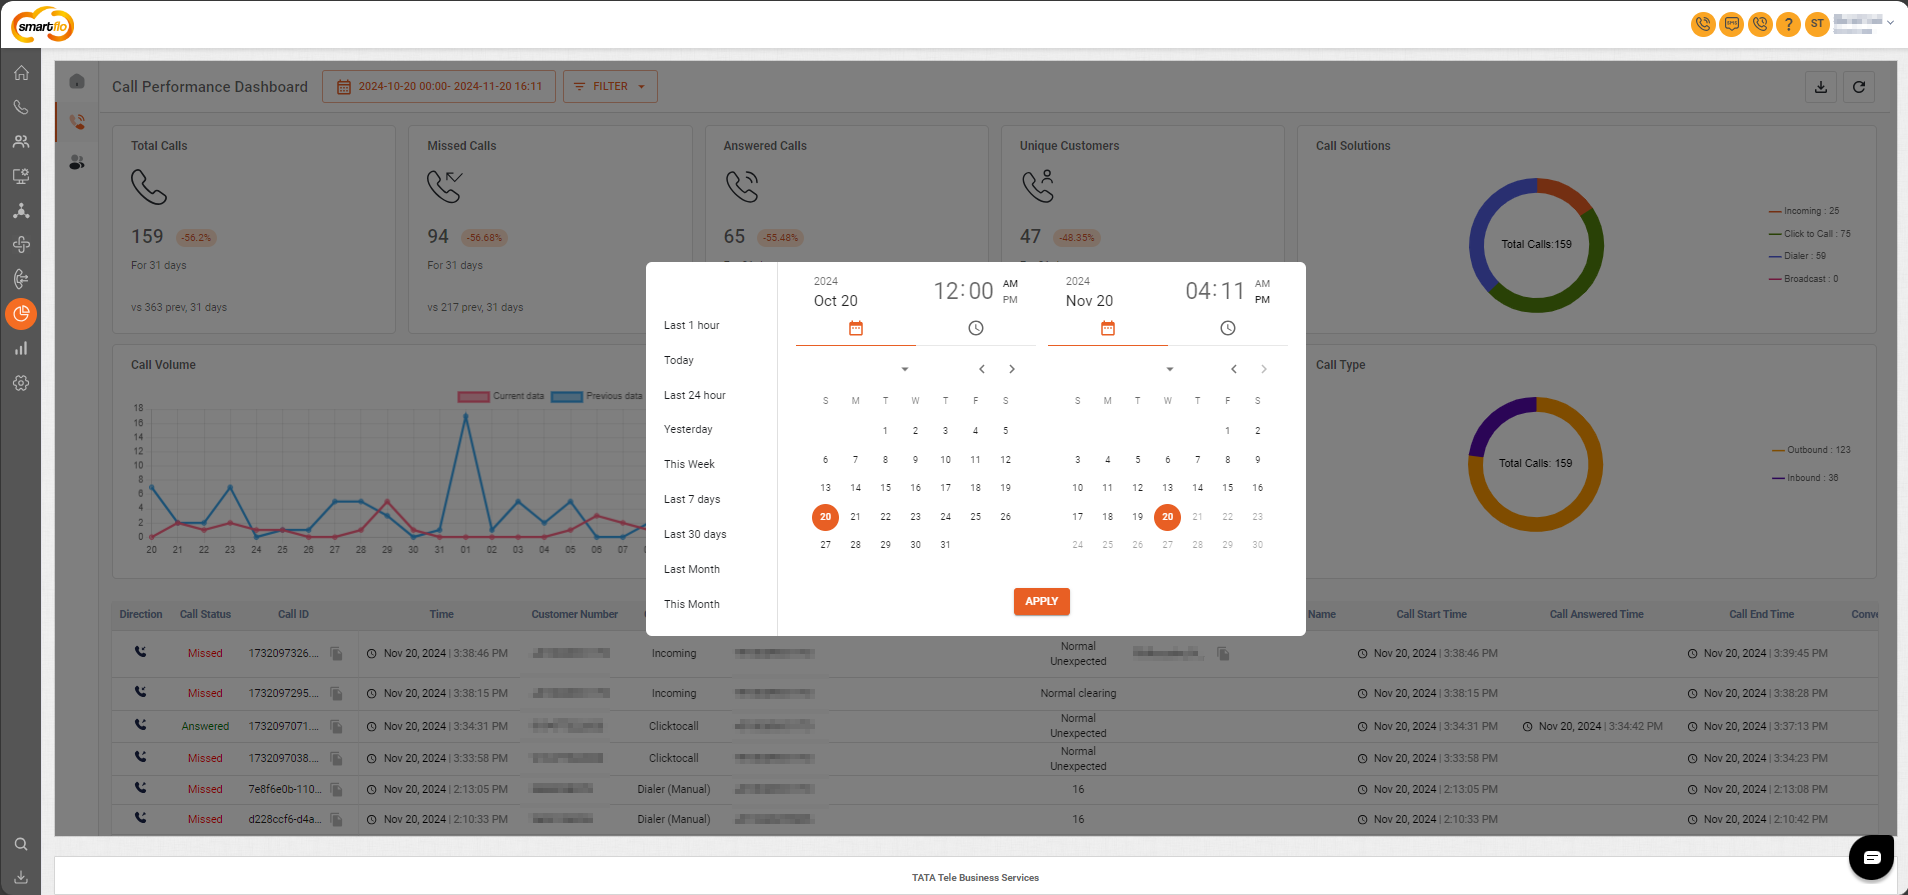
- The date selection tool allows users to define the time range for the dashboard data. Users can select predefined ranges (e.g., Last 7 Days, Last Month) or choose a custom time frame by specifying start and end dates/times. However, the filter allows selection of a maximum of 30 days in one go to ensure optimal performance and data accuracy.
- Filters
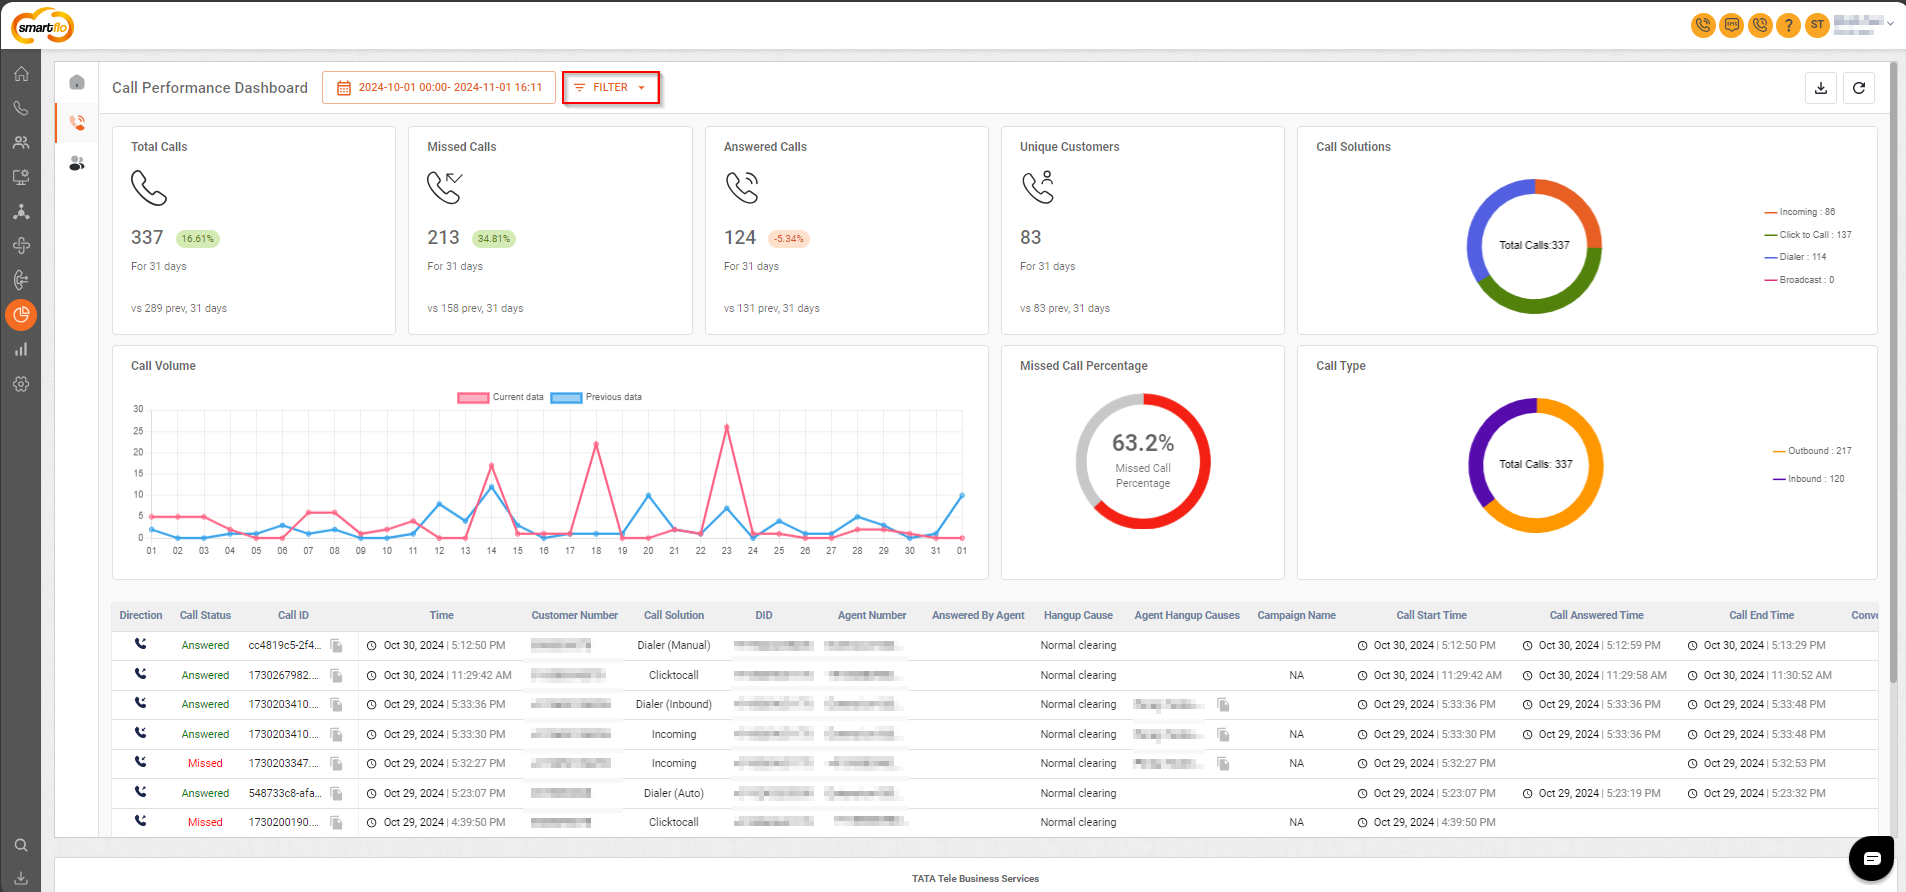
- Click on the filter tool, as shown in the screenshot above.
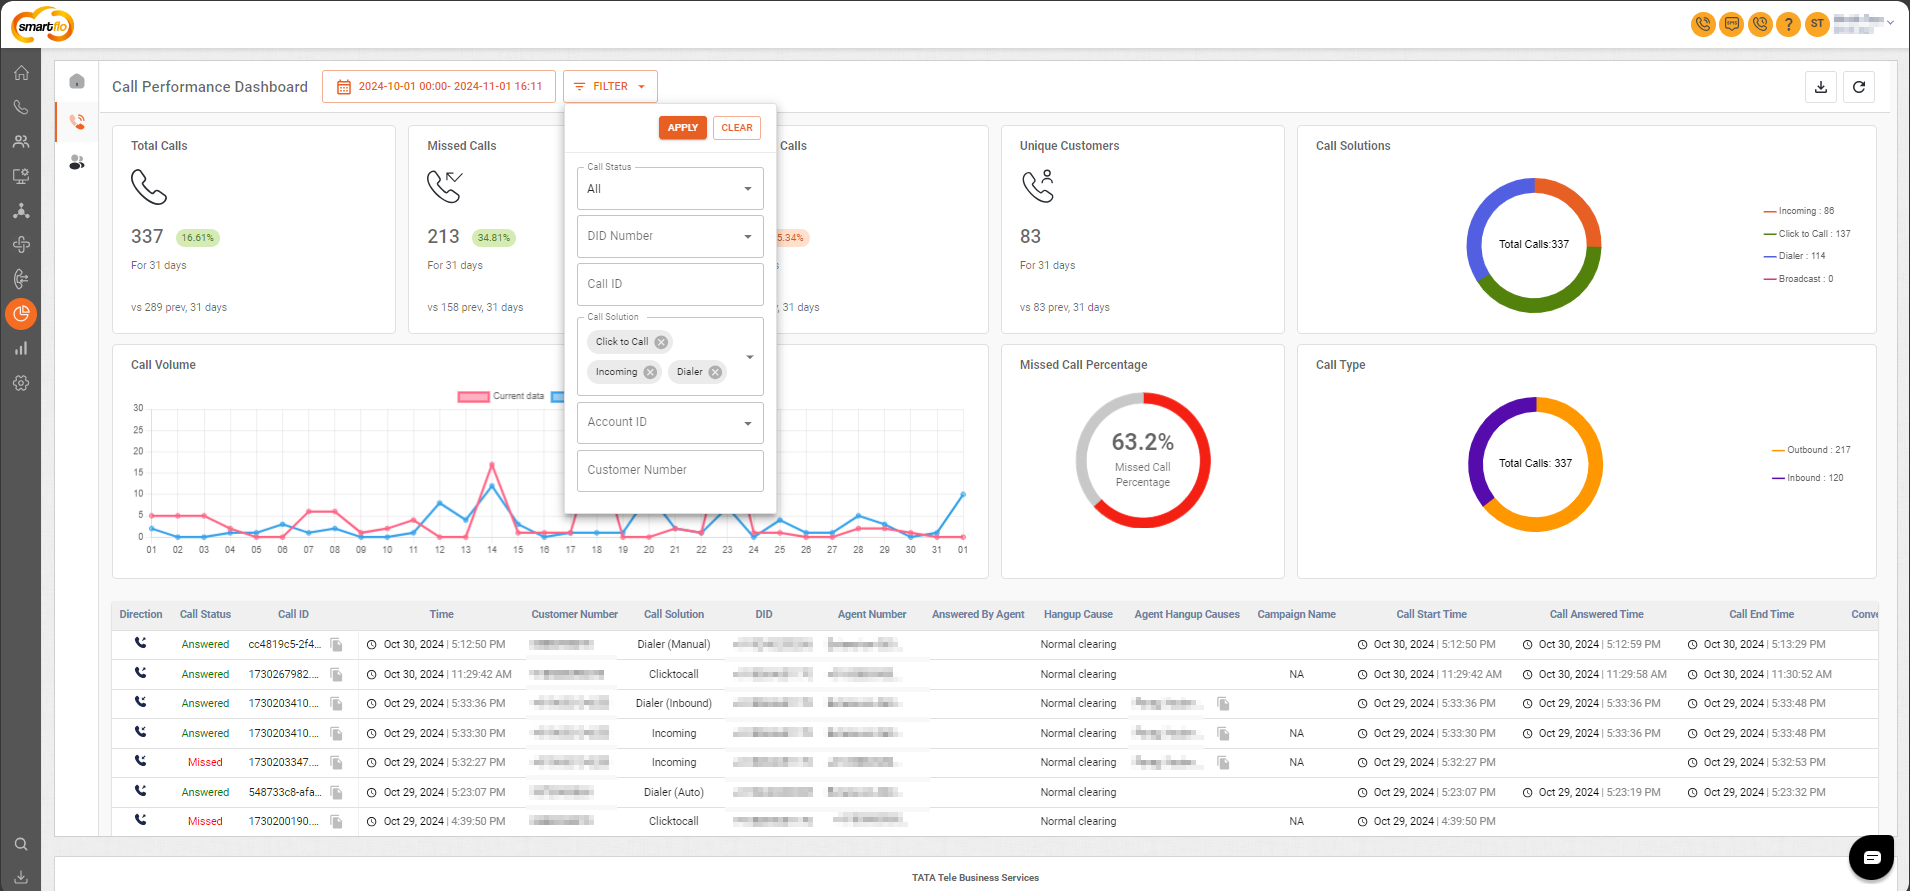
- The Filter option allows users to narrow down the displayed data based on specific criteria:
| Field | Description |
|---|---|
| Call Status | Filters calls by their status (All, Missed, Answered). |
| DID Number | Filters calls based on a specific phone number used to make or receive calls. This helps in analyzing call activity linked to that particular number. |
| Call ID | Searches for specific calls using their unique call ID. |
| Call Solution | Filters based on the call solution type, such as Click-to-Call, Incoming, Dialer, or Broadcast.
|
| Customer Number | Allows filtering calls by a specific customer number, referring to the consumer number, i.e., the phone numbers of your customers. |
- Metrics Displayed at the Top
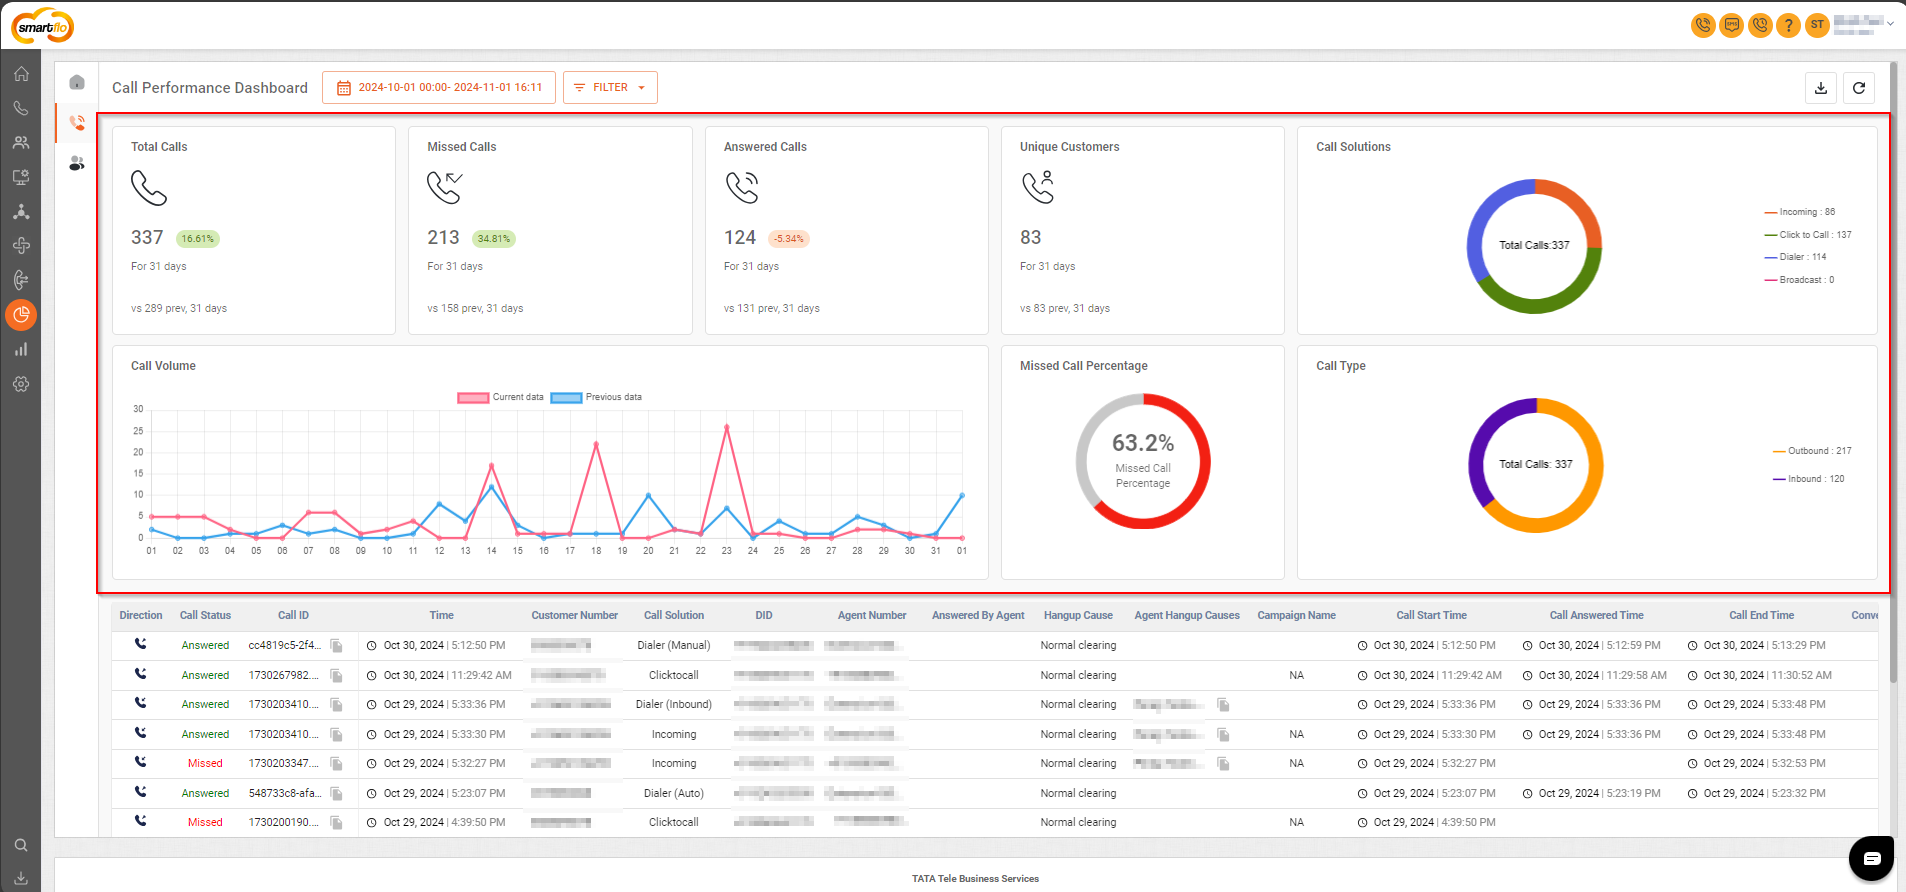
- The main metrics displayed at the top include:
| Field | Description |
|---|---|
| Total Calls | The total number of calls (incoming and outgoing) handled in the selected time period. |
| Missed Calls | The number of calls that were missed (not answered) by an agent or platform (missed on the department, missed on IVR, etc). |
| Answered Calls | The total number of calls that were successfully answered. |
| Unique Customers | The number of distinct customers who called during the selected time frame. Possible Cases could be:
|
| Call Solutions | Displays the breakdown of calls by their product (Incoming, Click to Call, Dialer, Broadcast). |
| Call Volume | This graph which serves as the Hero Widget on the dashboard is a key feature for the users. It helps them to compare current data with past data for the same period, making it easy to spot trends and changes. How It Works:
|
| Missed Call Percentage | Shows the percentage of missed calls relative to the total calls made or received. |
| Call Type | Segregates calls by type (Inbound, Outbound). |
- Key Performance Indicators (KPIs) at the Bottom
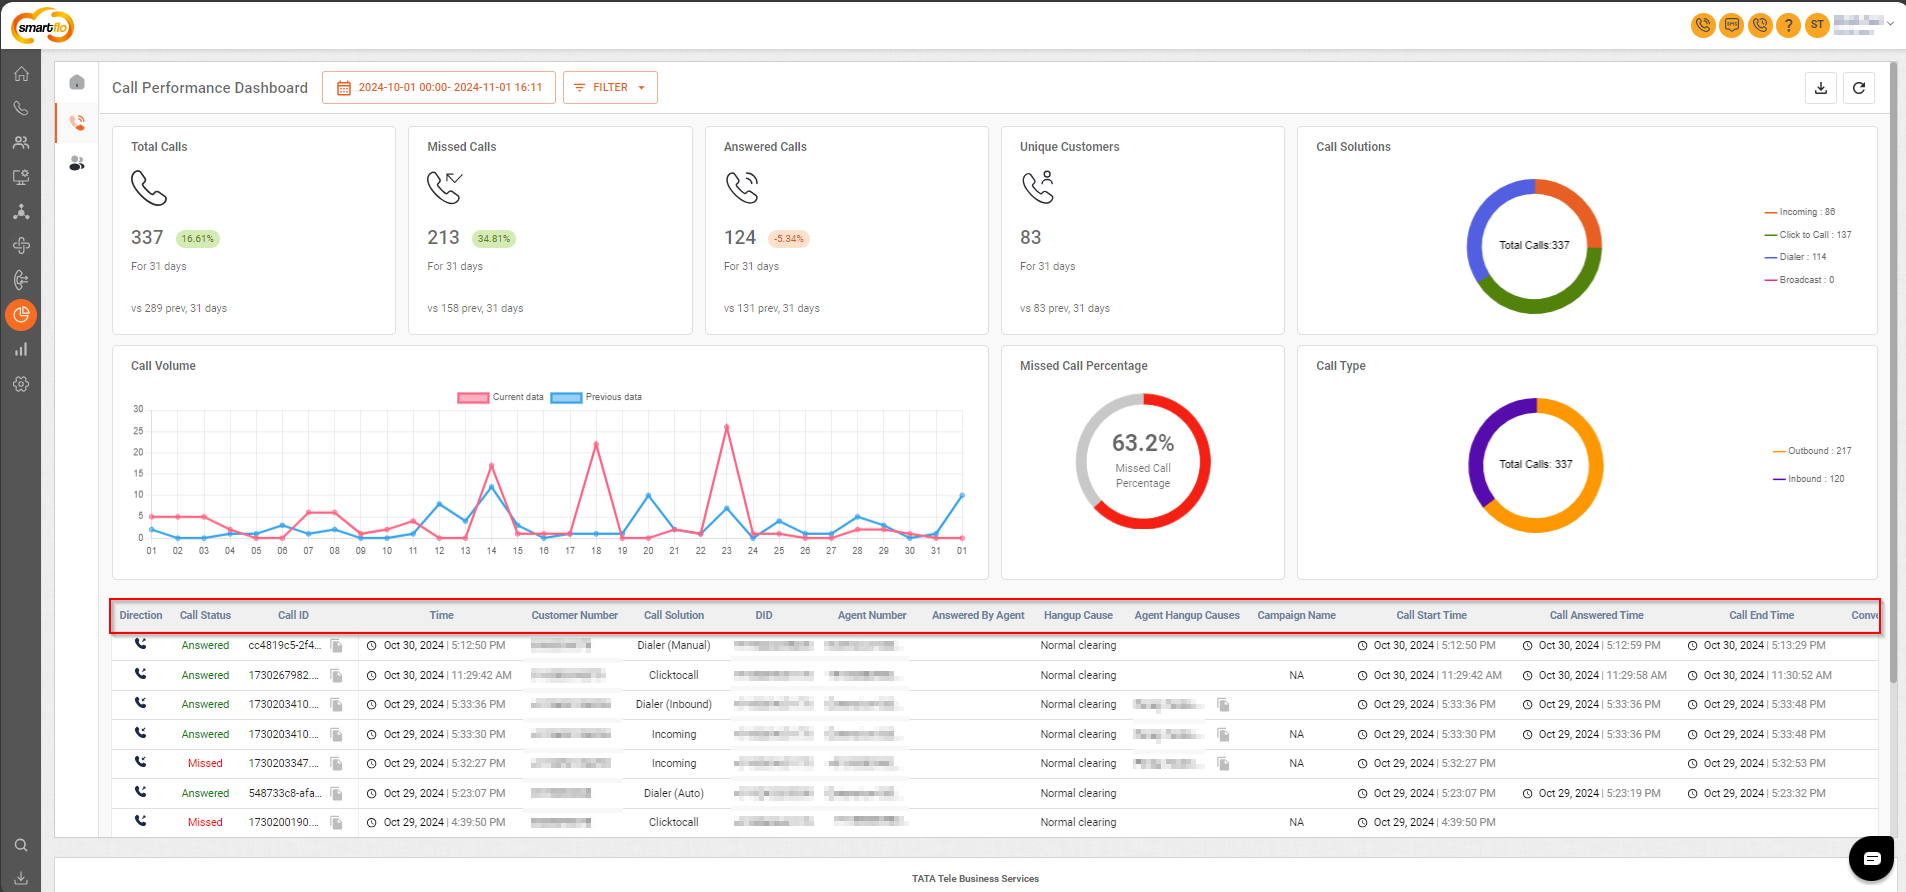
- The following KPIs provide data about call performance and details:
- Download Report and Refresh Data
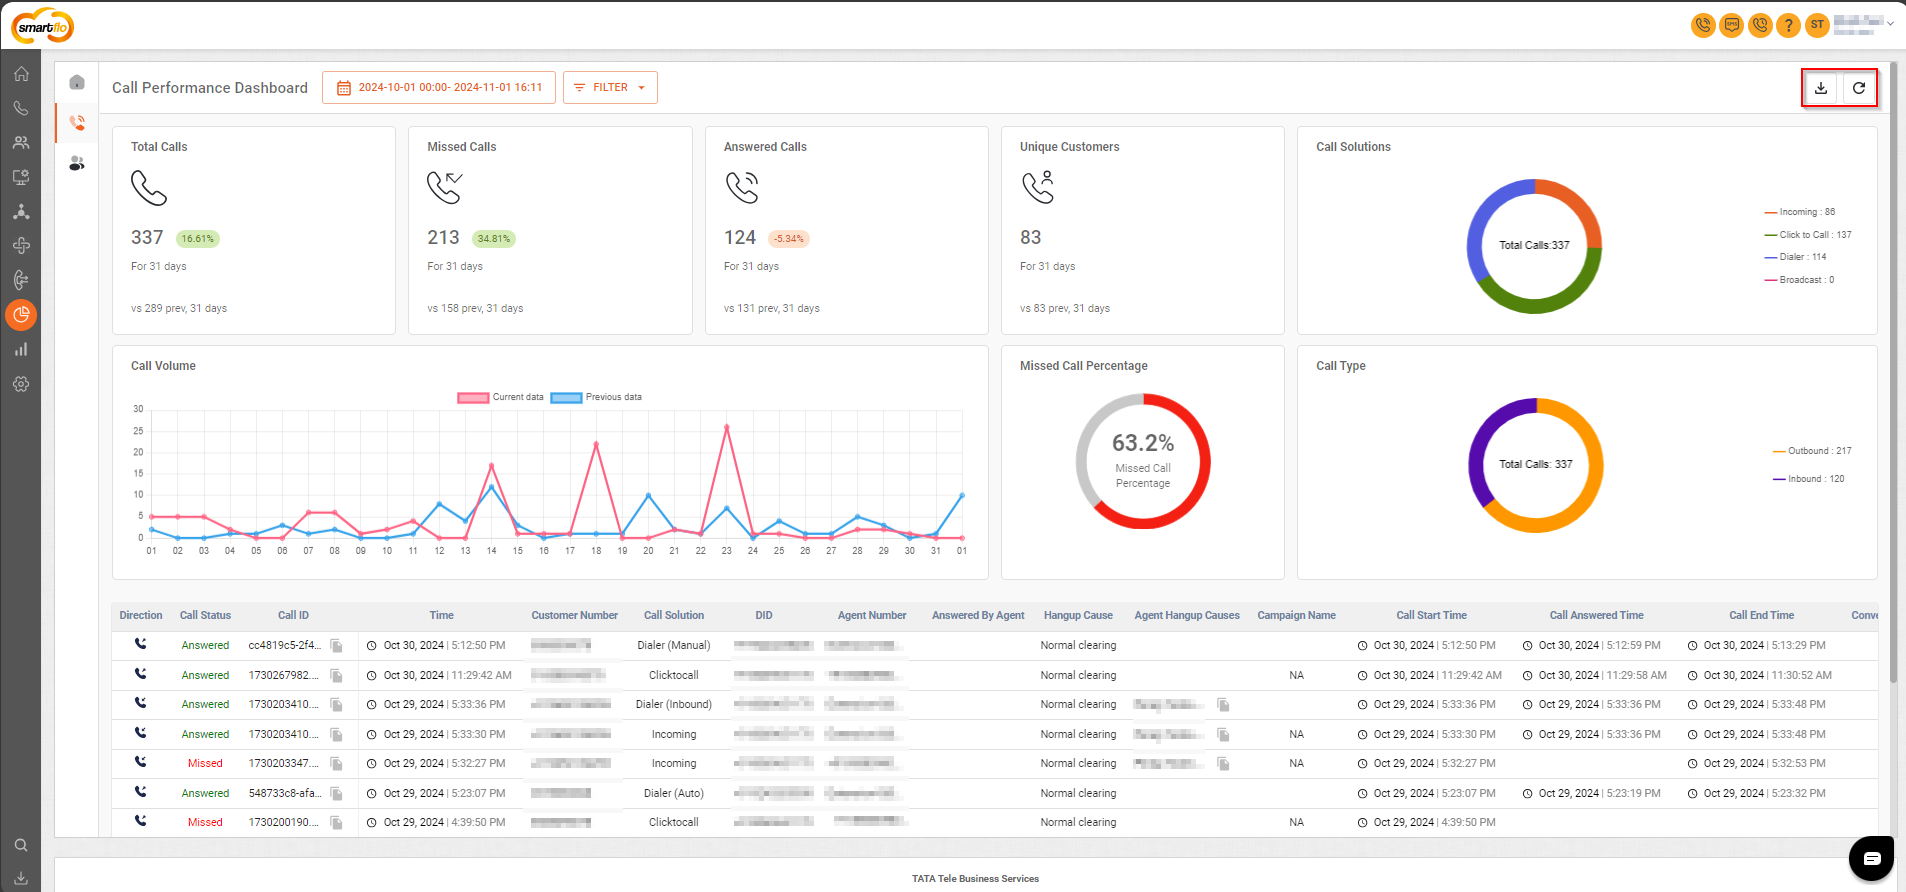
- Download Report and Refresh options are located in the top-right corner of the Call Performance Dashboard:
- Steps to Download the Call Performance Report:
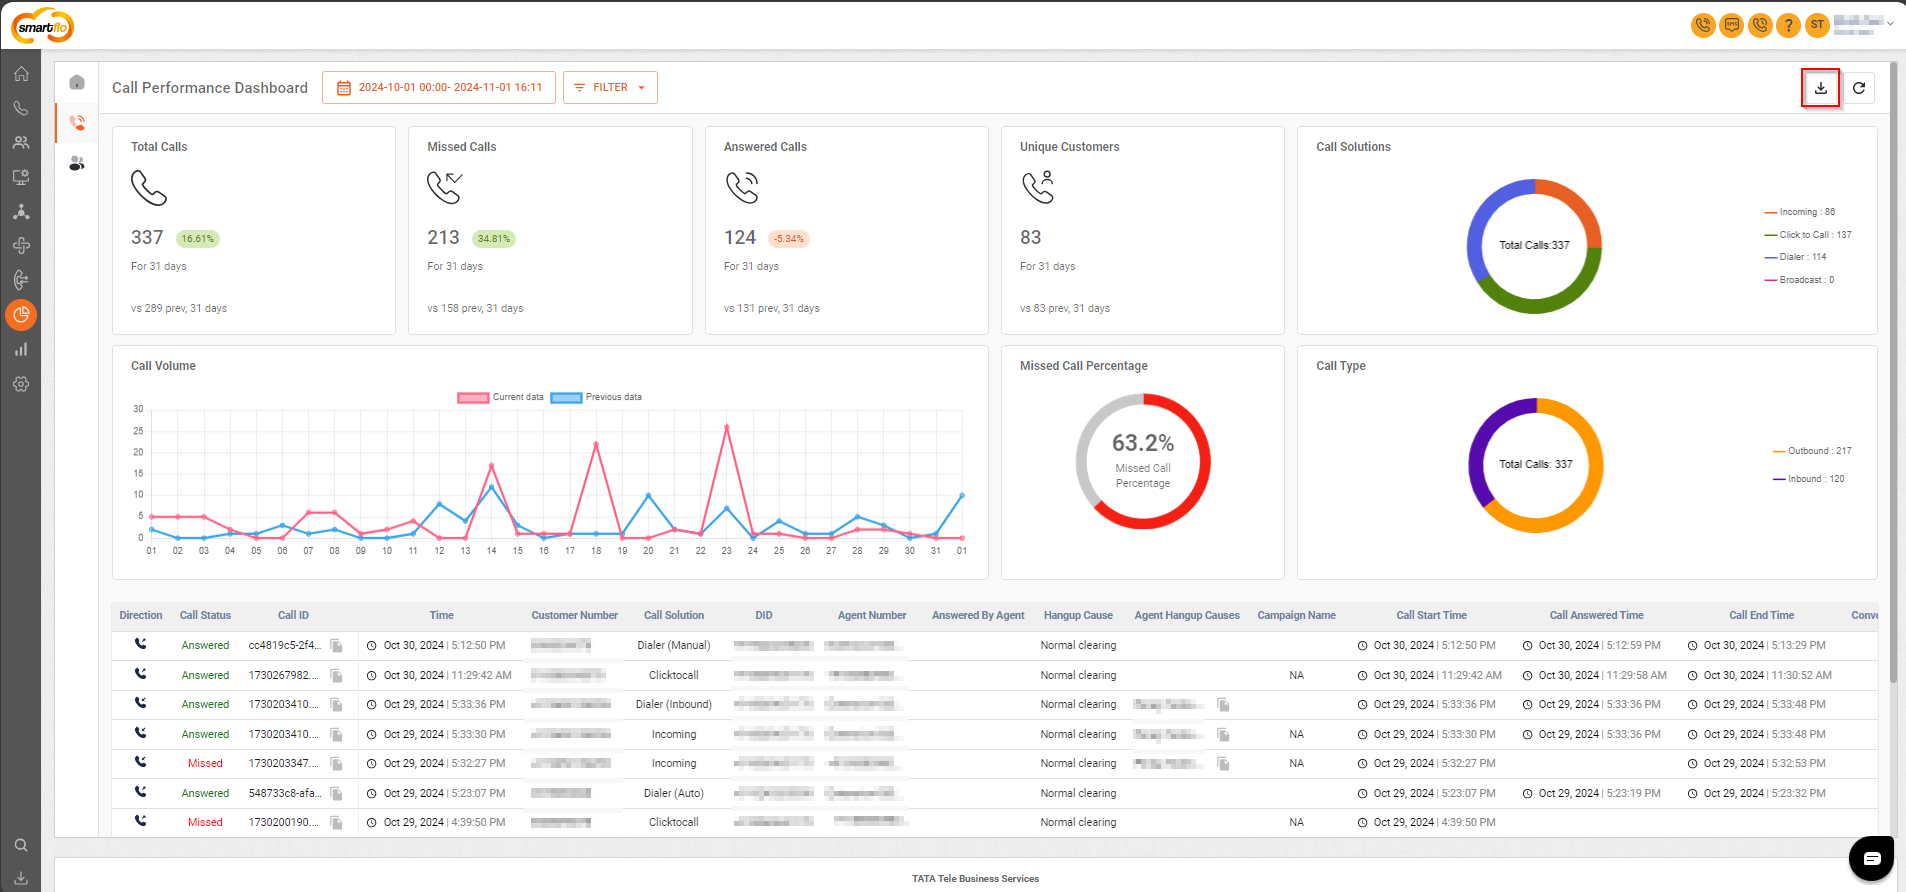
- Navigate to the Call Performance Dashboard and click on the Download icon located in the top-right corner (highlighted in the screenshot).
- After clicking, a notification will appear, stating: "Your report is almost ready. We’ll email it to you shortly."
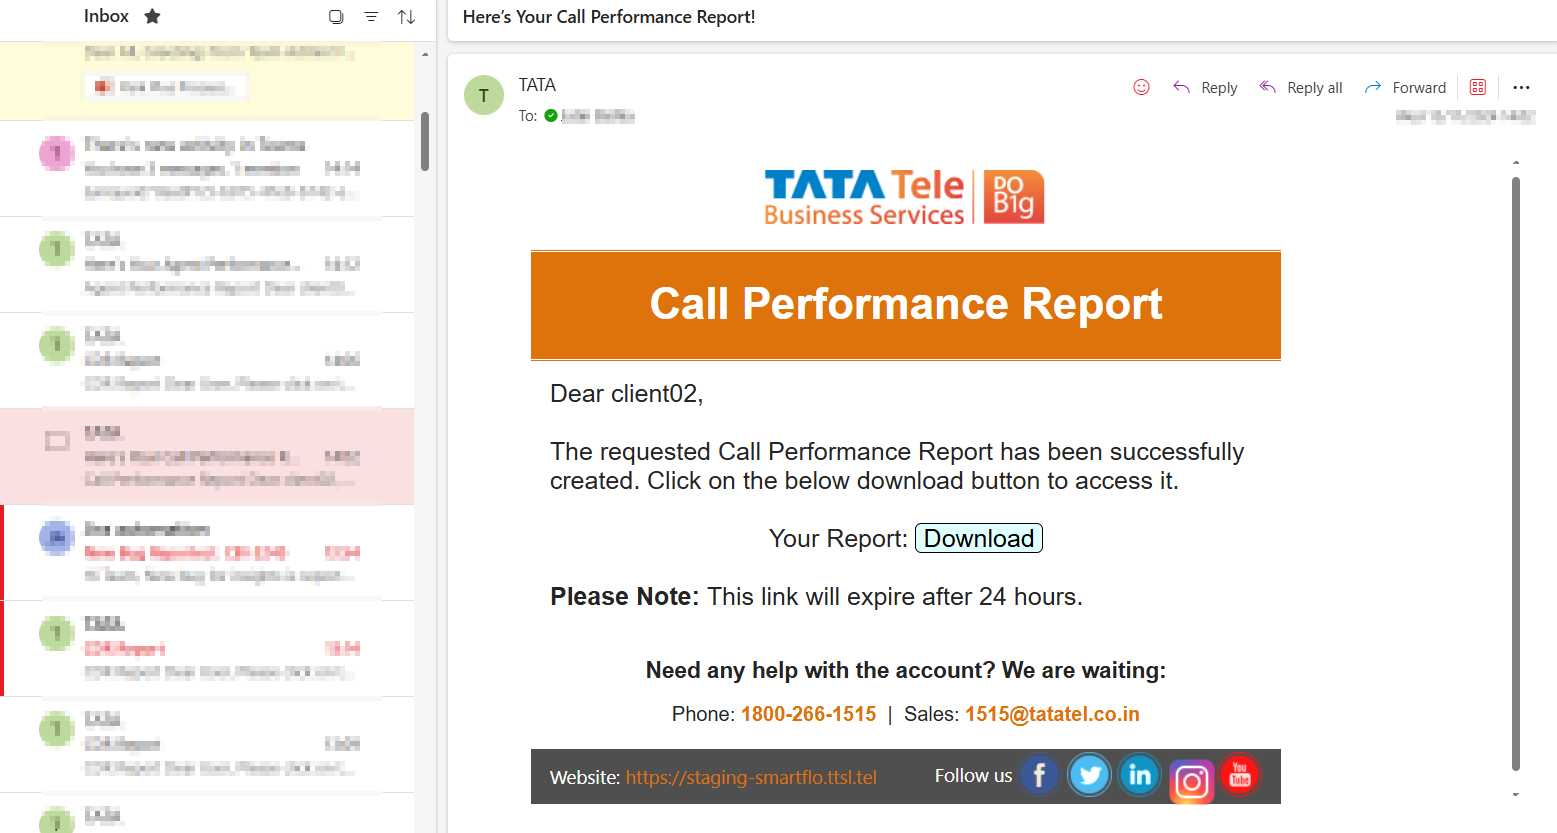
- The report will be sent to your registered email address. Open the email titled "Here’s Your Call Performance Report!" to access the download link.
- Click on Download, and the file will be saved to your device's default download location.
- Recent Downloads
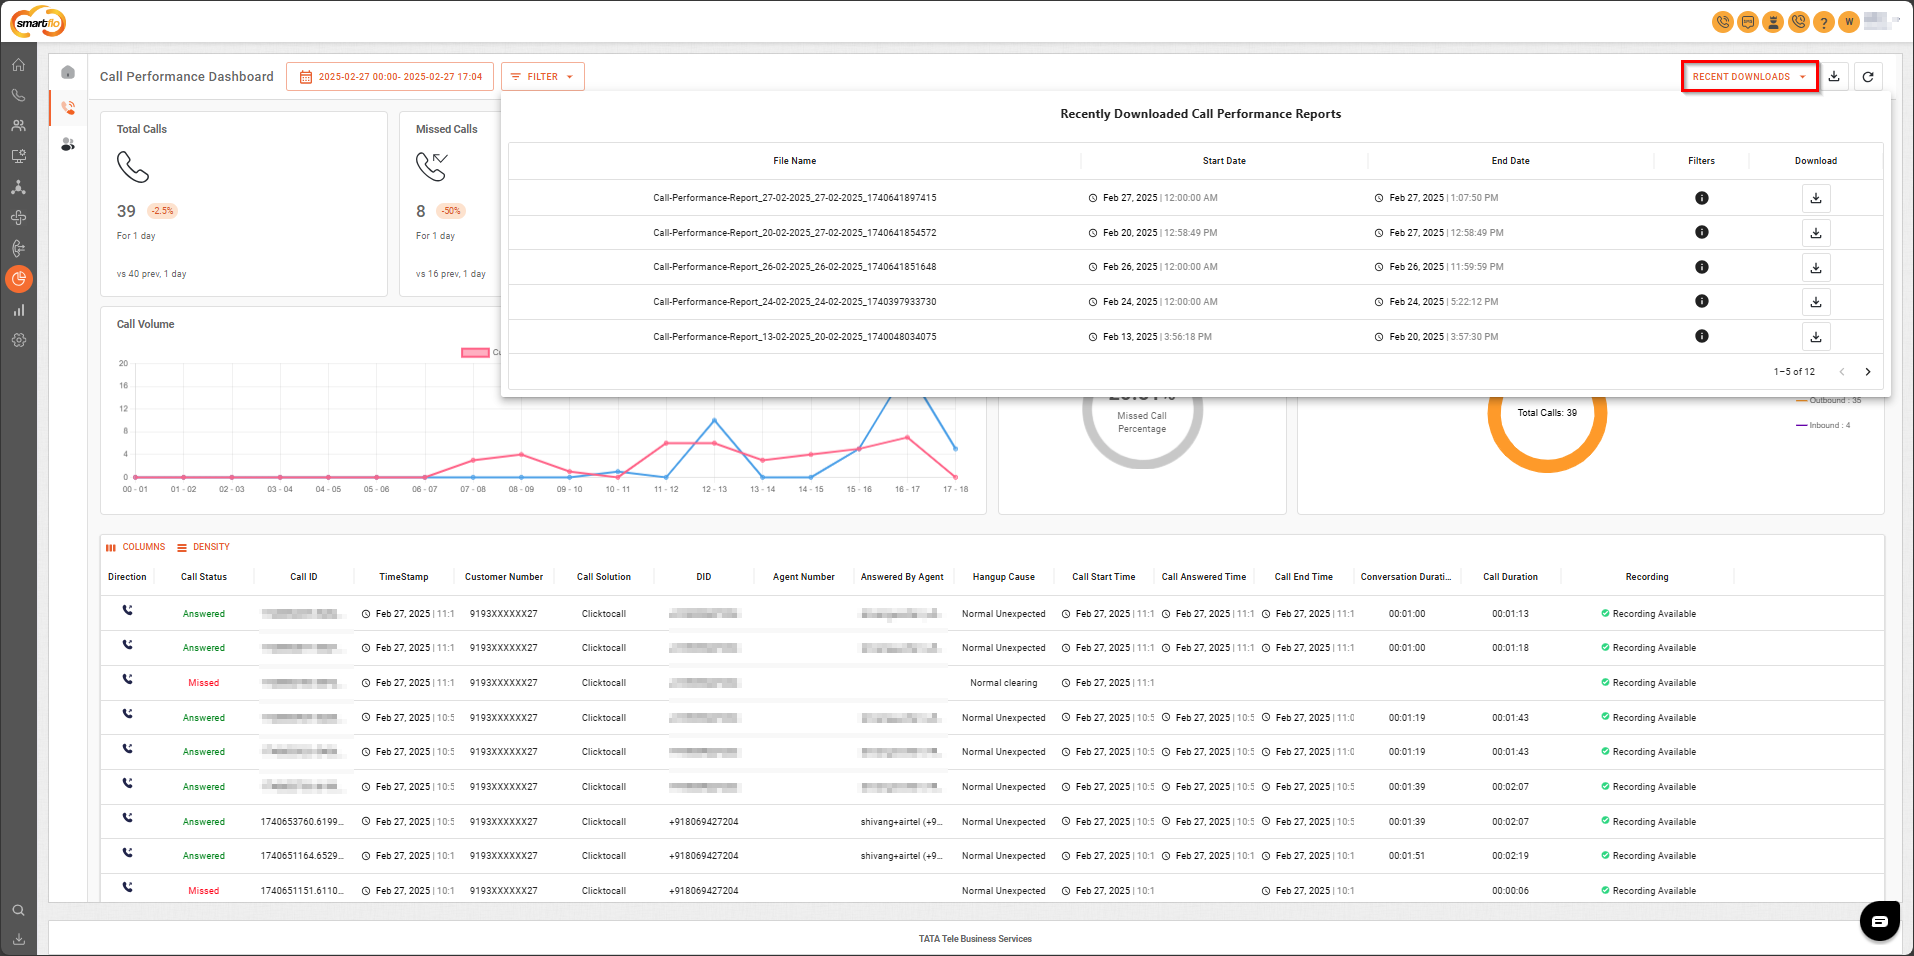
The "Recent Downloads" section in the Call Performance Dashboard displays a list of reports that have been recently downloaded by the user. It helps in tracking and managing previously generated reports.
| Field | Description |
|---|---|
| File Name | The name of the downloaded call performance report, covering the specified date range. |
| Start Date | The beginning date for the call data included in the report. |
| End Date | The ending date for the call data in the report. |
| Filters | Criteria applied while generating the report. |
| Download | A button to re-download the report if needed. |
FAQs
- Why is my call marked as a missed call even when I see there is some talktime in the call log?
- Our platform marks a call as a missed call in case the talktime over a call is less than 1 second. This is known system behavior, and we will not be able to manually change the call status from missed to answered.
- Understanding the Difference Between Call Performance Dashboard and Agent Performance Dashboard
Call Performance Data (CPD) and Agent Performance Data (APD) are distinct datasets and are not directly comparable.
- CPD focuses on calls — analyzing the full lifecycle of each call, including IVR flows, call routing, and abandonment.
- APD focuses on agents — tracking individual agent performance metrics like answered/missed calls, talk time, and wrap-up duration.
Example:
If one customer call is routed to 5 agents but answered by only 1:
- CPD records 1 call
- APD shows 5 agent interactions (4 missed, 1 answered)
🔍 Use APD to assess agent responsiveness and productivity.
📈 Use CPD to study call volume trends and system performance.
Updated about 1 year ago