Department Performance Report
Date Selection
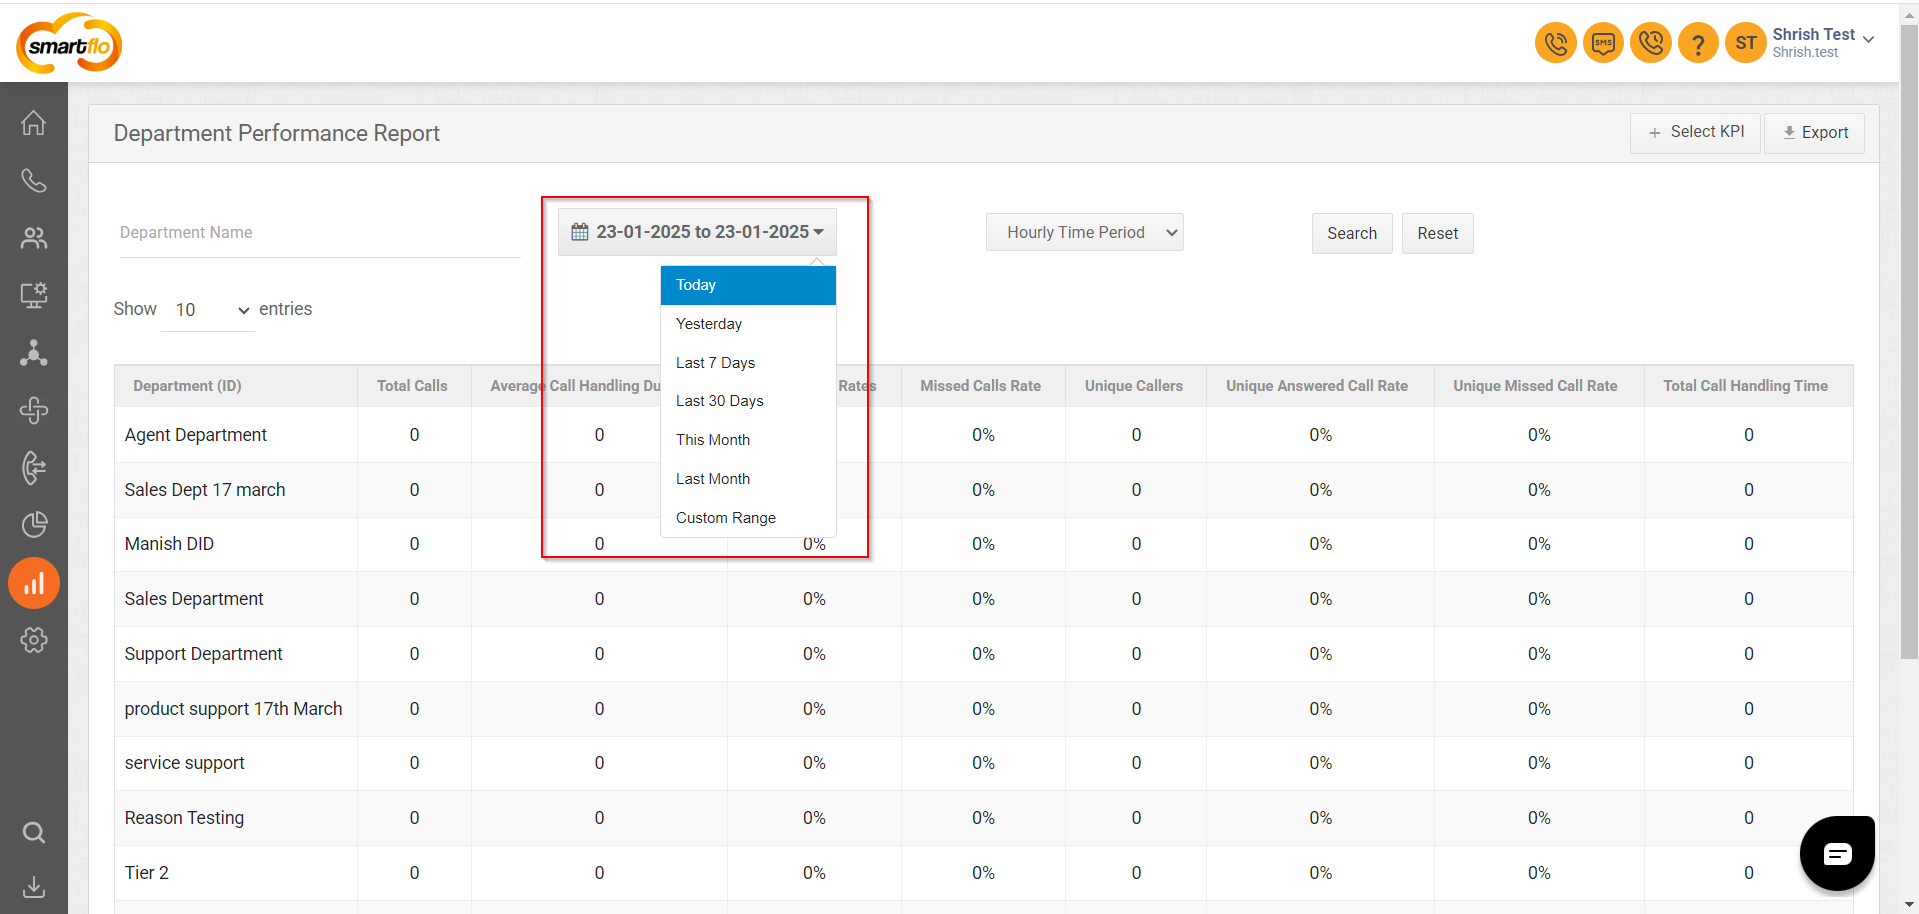
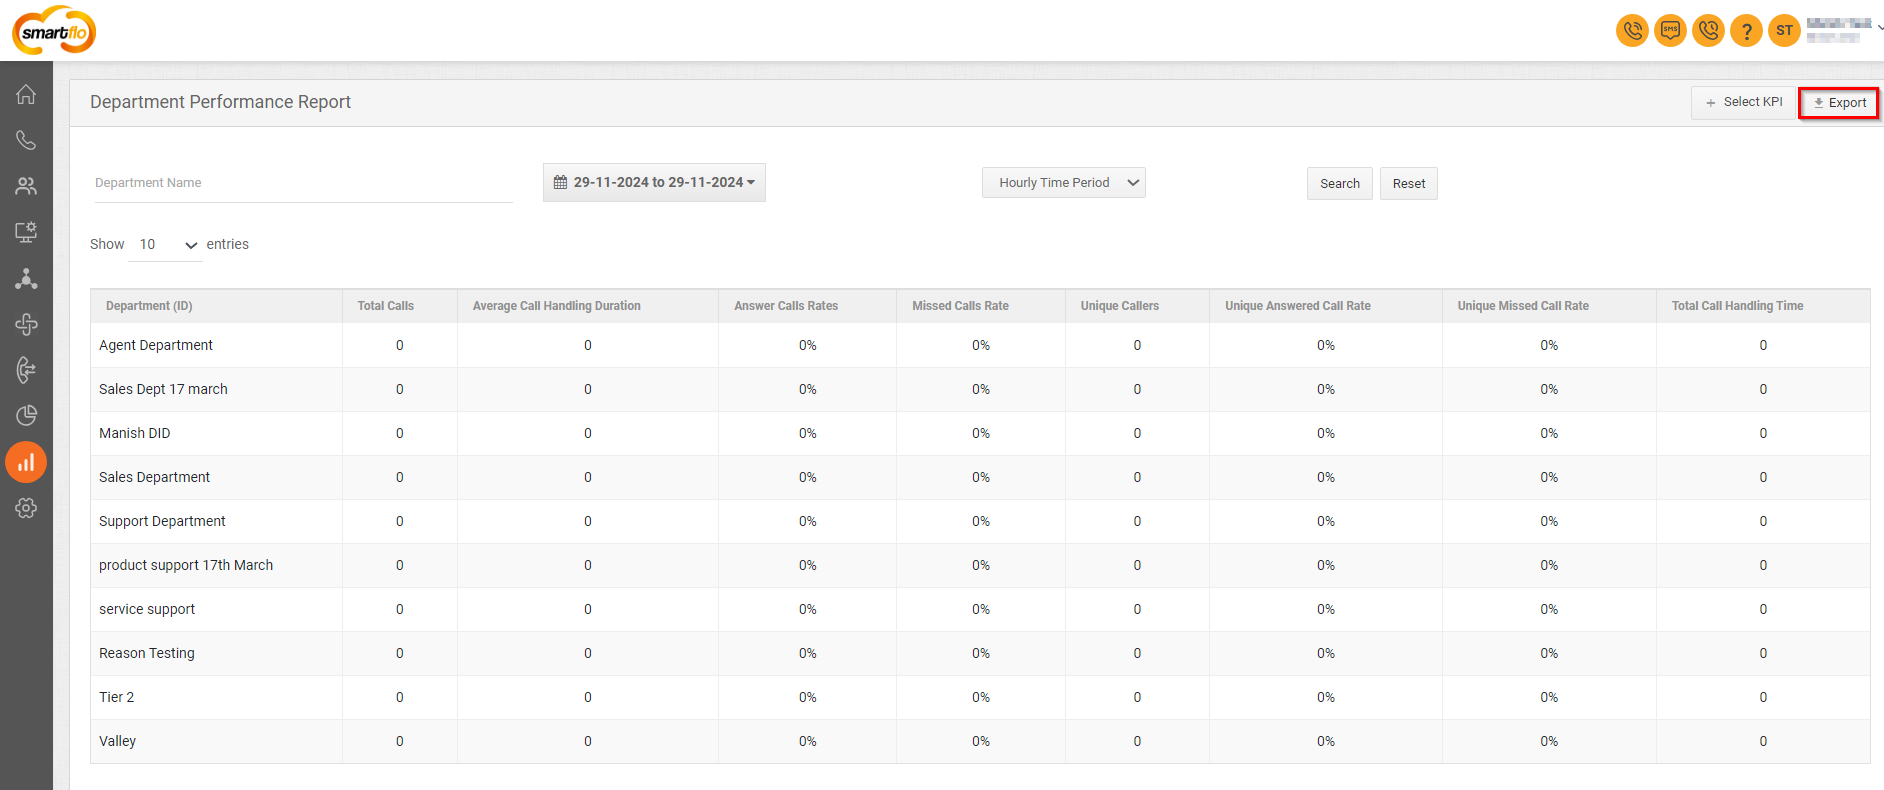
- Click on the date selection tool, as shown in the screenshot above.
- The date selection tool allows users to define the time range for the dashboard data. Users can select predefined ranges (e.g., Last 7 Days, Last Month) or choose a custom time frame by specifying start and end dates/times. However, the filter allows the selection of a maximum of 30 days in one go to ensure optimal performance and data accuracy.
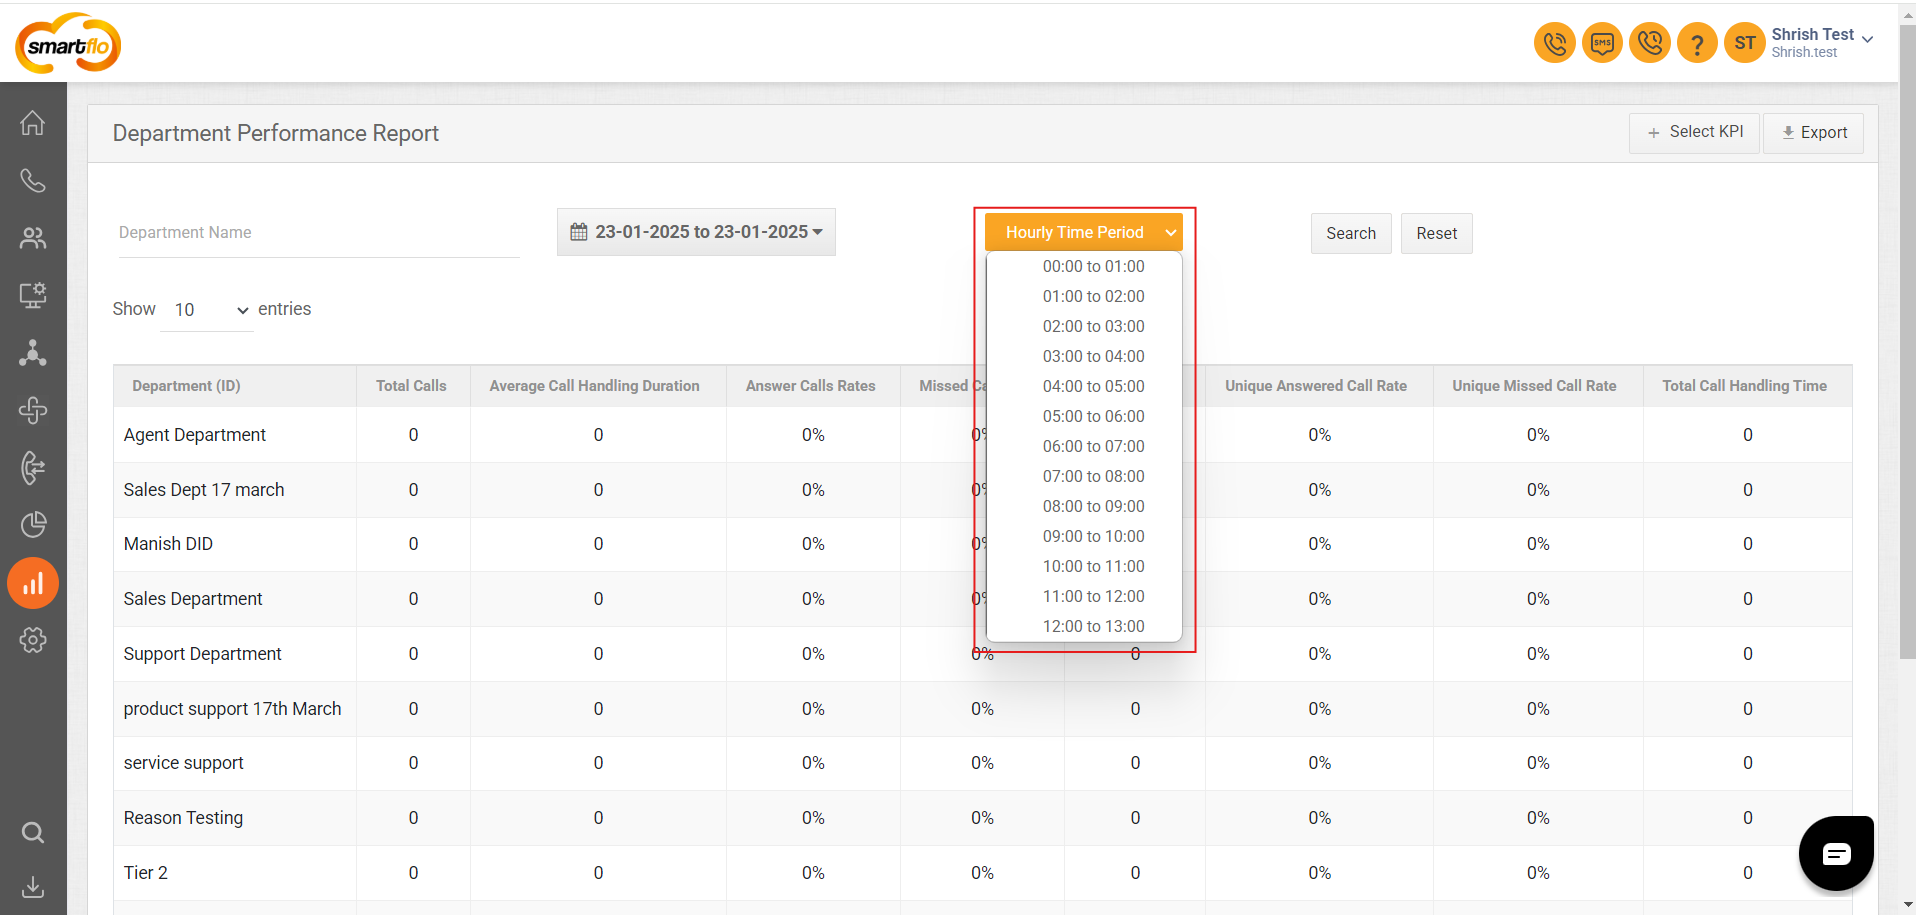
- Click on the Hourly Time Period option to retrieve the department performance report on an hourly basis.
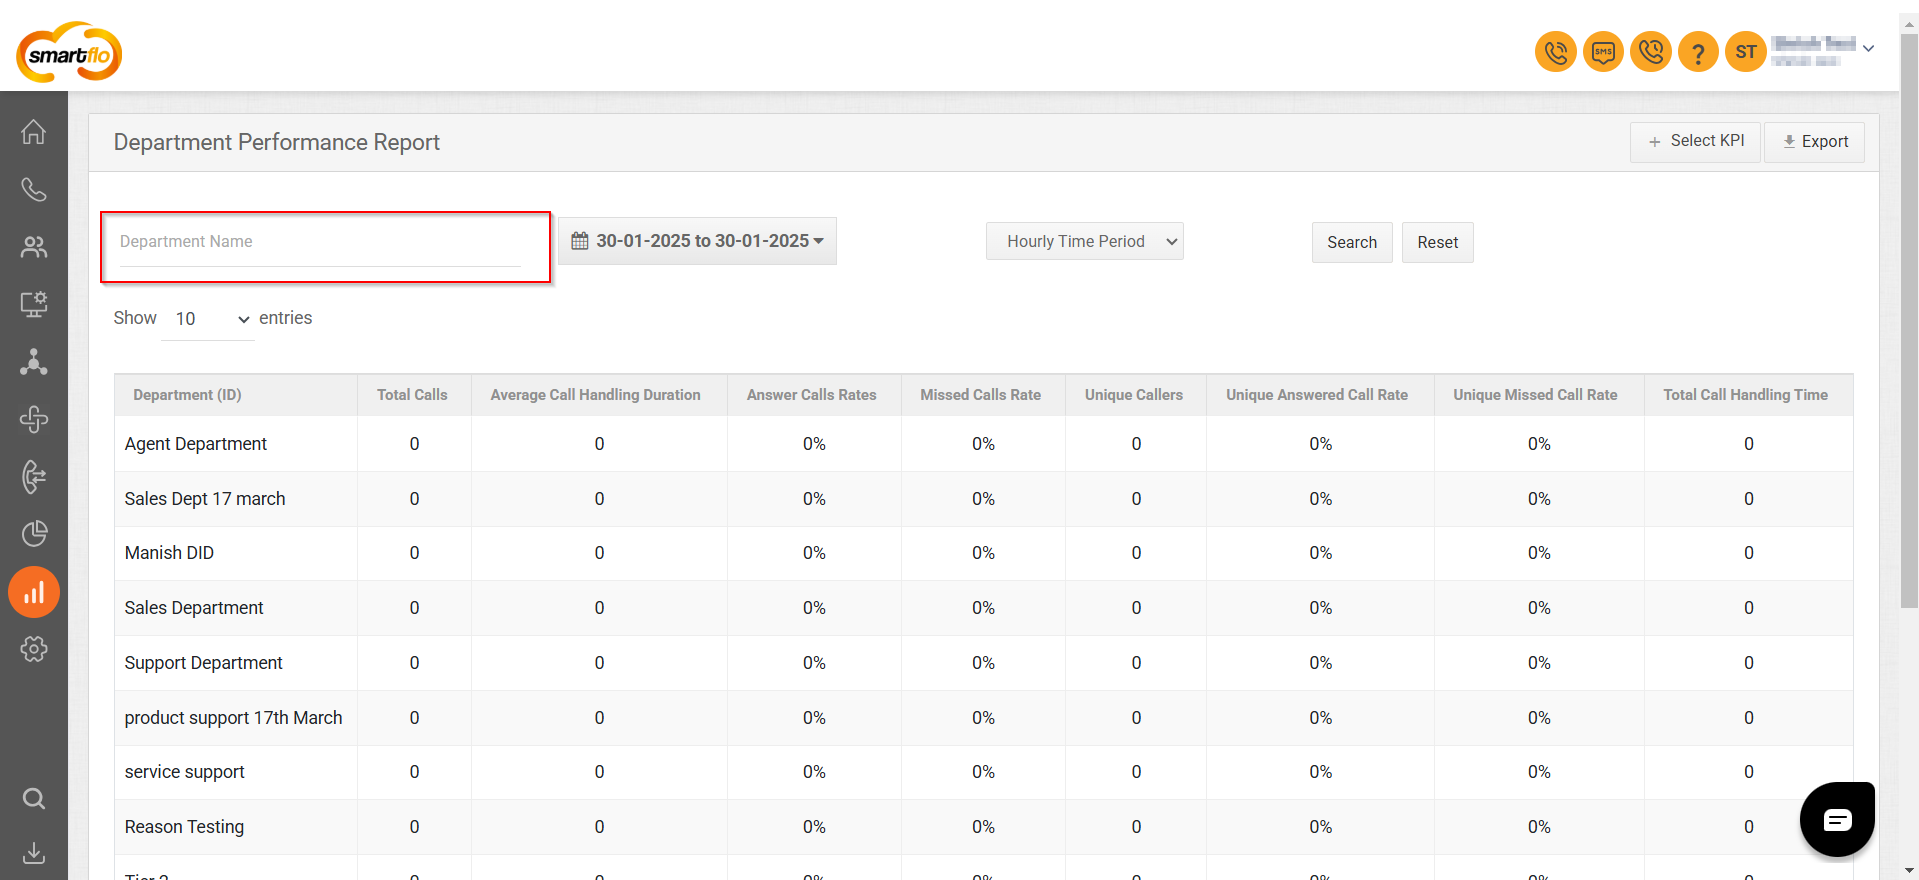
Filter by Department
- To filter the report by specific department:
- Click Department name in the top-left corner of the page.
- Enter the name of the department.
- Click Search to apply the filter.
Field Descriptions
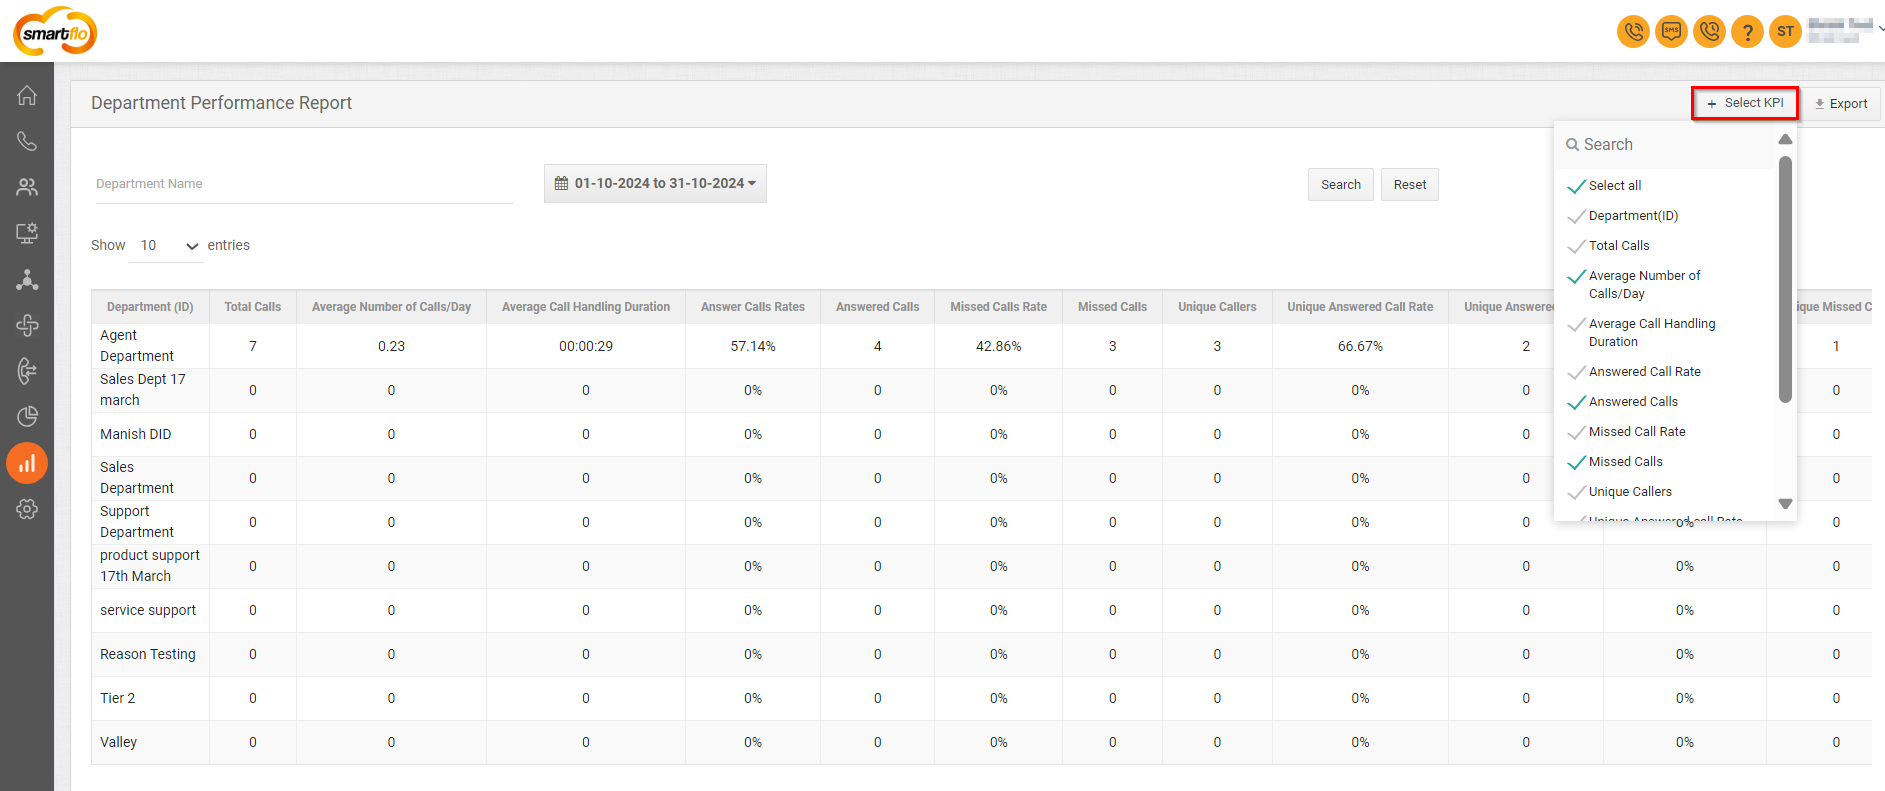
- The report consists of the following fields:
| Field | Description |
|---|---|
| Department (ID) | The name of the department. |
| Total Calls | The total number of calls received by the department. |
| Average Number of Calls/Day | The average number of calls received per day. Formula: Total number of calls / Number of days. |
| Average Call Handling Time | The average time taken to handle a call. Formula=Total time taken to handle calls/Total number of calls. |
| Answered Call Rate | The percentage of calls answered by the department. Formula: (Answered calls / Total calls)* 100. |
| Answered Calls | The total number of calls answered by the department. |
| Missed Call Rate | The percentage of calls missed by the department. Formula: (Missed calls / Total calls)* 100. |
| Missed Calls | The total number of calls missed by the department. |
| Unique Callers | The total number of unique callers to the department. |
| Unique Answered Call Rate | The percentage of unique calls answered by the department. Formula: (Unique answered calls / Total calls)* 100. |
| Unique Answered Calls | The total number of unique calls answered by the department. |
| Unique Missed Call Rate | The percentage of unique calls missed by the department. Formula: (Unique missed calls / Total calls)* 100. |
| Unique Missed Calls | The total number of unique calls missed by the department. |
| Total Call Handling Time | The total time spent handling calls. |
Duration/Time is shown in HH:MM:SS format.
Export Report
| Feature | Description |
|---|---|
| Export | Provides an option to export the current report data in a file format such as Excel or CSV for external use. |
Updated over 1 year ago