Webhook Logs
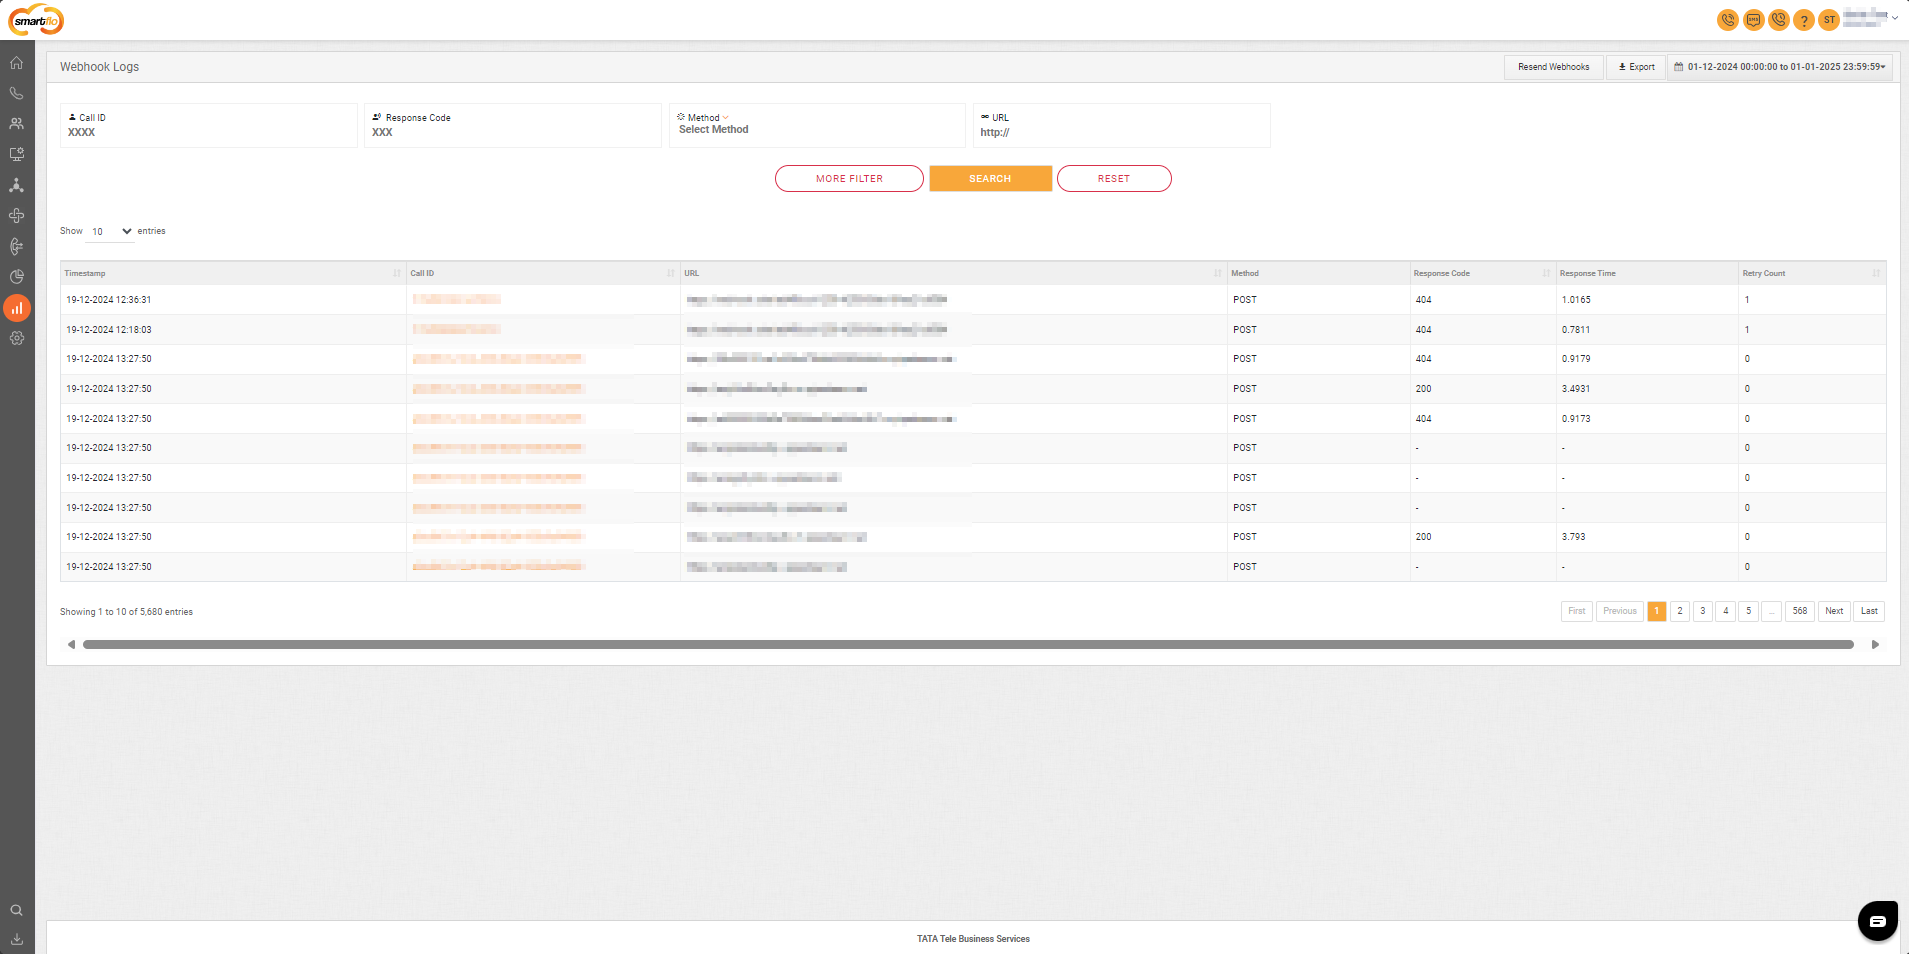
The Webhook Logs page provides a detailed history of webhook activities, allowing users to monitor, filter, and analyze webhook interactions efficiently.
Field Descriptions
| Field | Description |
|---|---|
| Timestamp | Displays the date and time the webhook was triggered. |
| Call ID | The unique identifier associated with the call triggering the webhook. |
| URL | The endpoint where the webhook payload was sent. |
| Method | The HTTP method used for the webhook request (e.g., POST, GET). |
| Response Code | The HTTP response code returned by the server (e.g., 200 for success, 404 for not found). |
| Response Time | Time taken (in seconds) for the server to respond to the webhook request. |
| Retry Count | The number of retry attempts made if the initial webhook request failed. |
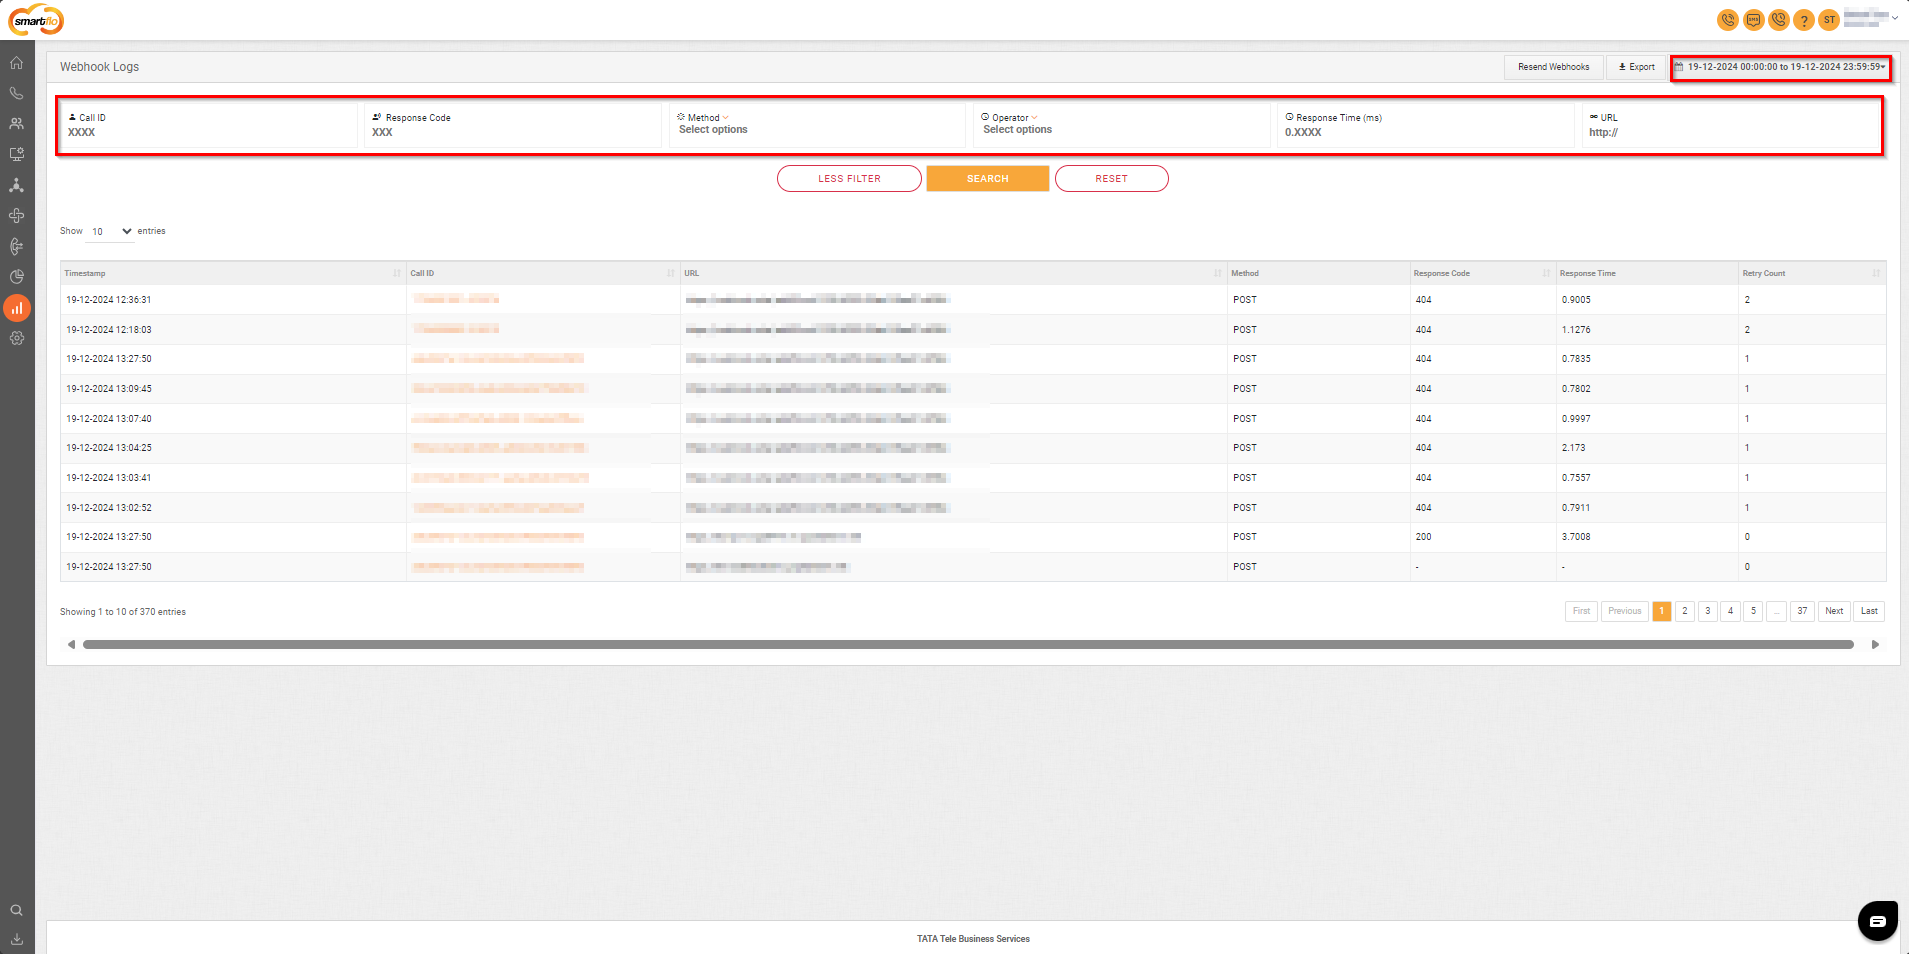
Filters
| Filter | Description |
|---|---|
| Call ID | Enables filtering based on a specific Call ID (unique identifier for the call associated with the webhook). |
| Response Code | Filters results based on HTTP response codes (e.g., 200, 404). |
| Method | Filters results based on the method used for the webhook request. Options include: GET: Used for retrieving data from the server. |
| URL | Filters by the specific endpoint URL to which the webhook payload was sent. |
| More Filter Options | Operator: Allows conditional filtering for numerical fields such as response time. Available operators are: Equal to (=): Filters results matching the exact value. Response Time (ms): Filters based on the time taken (in milliseconds) for the webhook response. |
| Date Range | Enables users to select a specific time period to view logs (from and to date). |
Resend Webhooks
- Users can manually resend failed webhook requests to resolve issues.
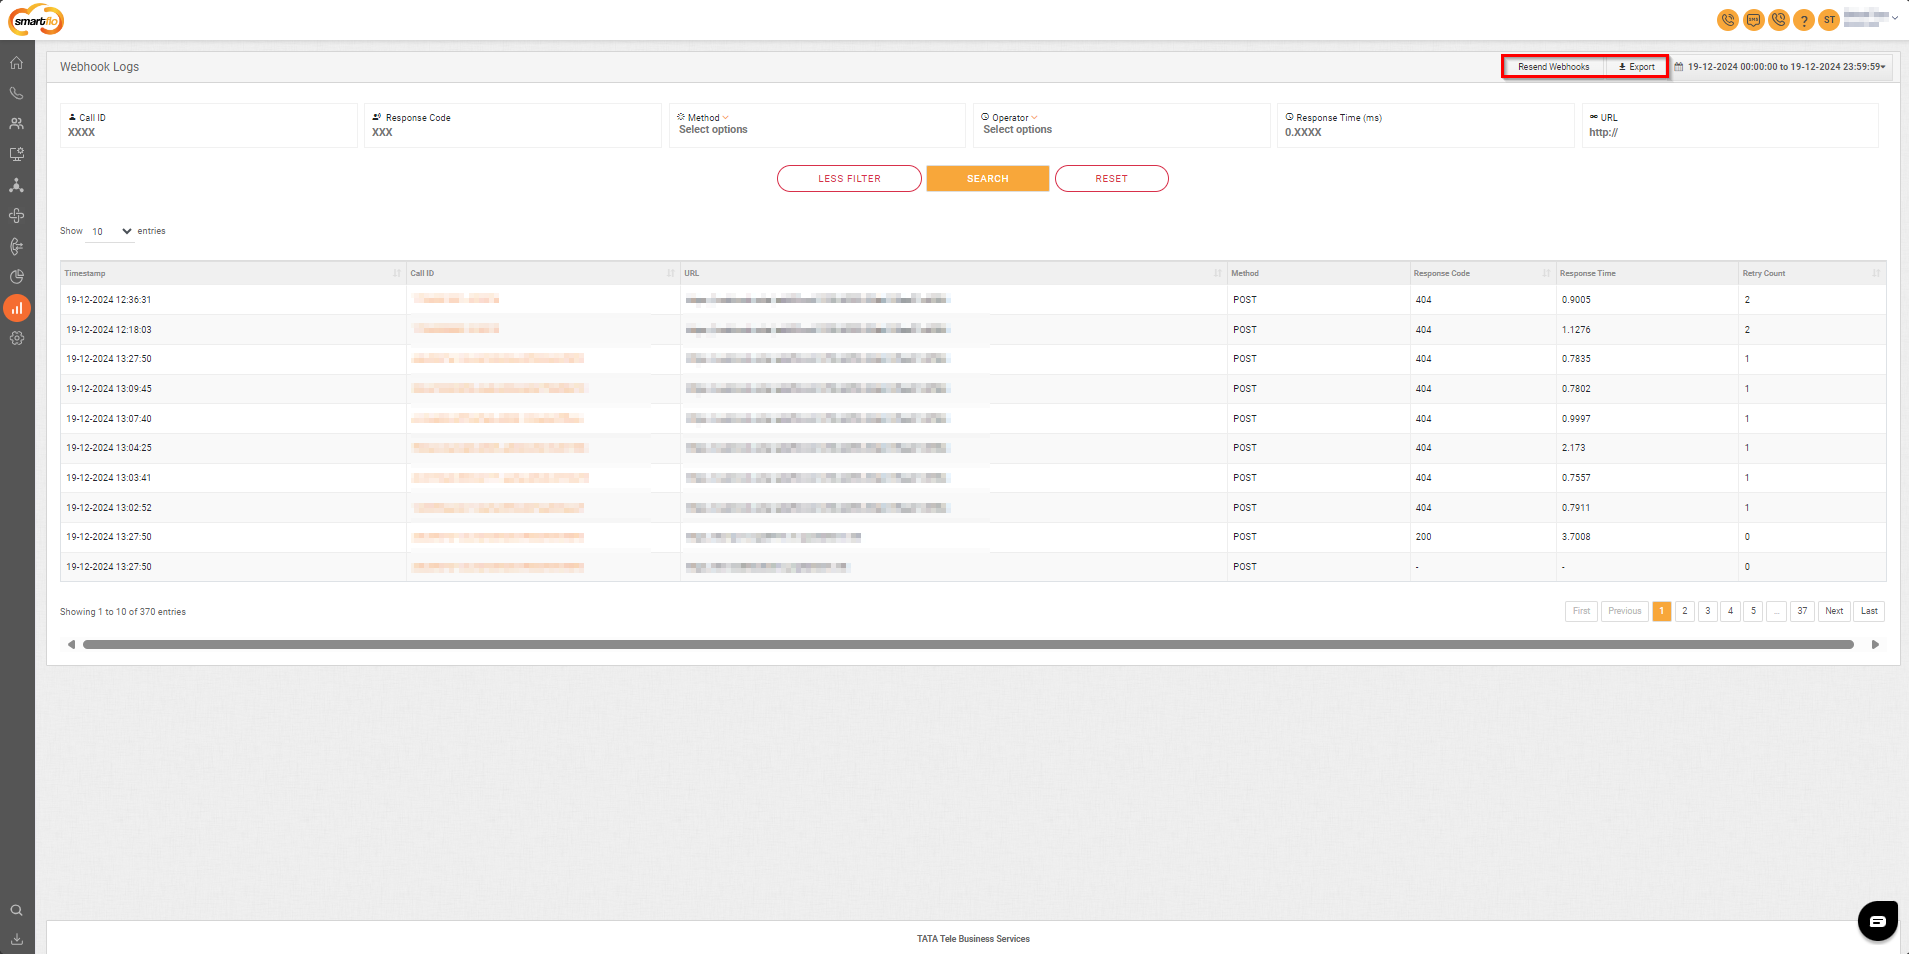
Export Logs
- Export functionality allows logs to be downloaded for offline review and troubleshooting in CSV format.
When you click on the Call ID (a clickable link) in the Webhook Logs report, it takes you to a detailed Webhook Log Details Page. Here’s an explanation of the components on this page:
Webhook Log Details Page
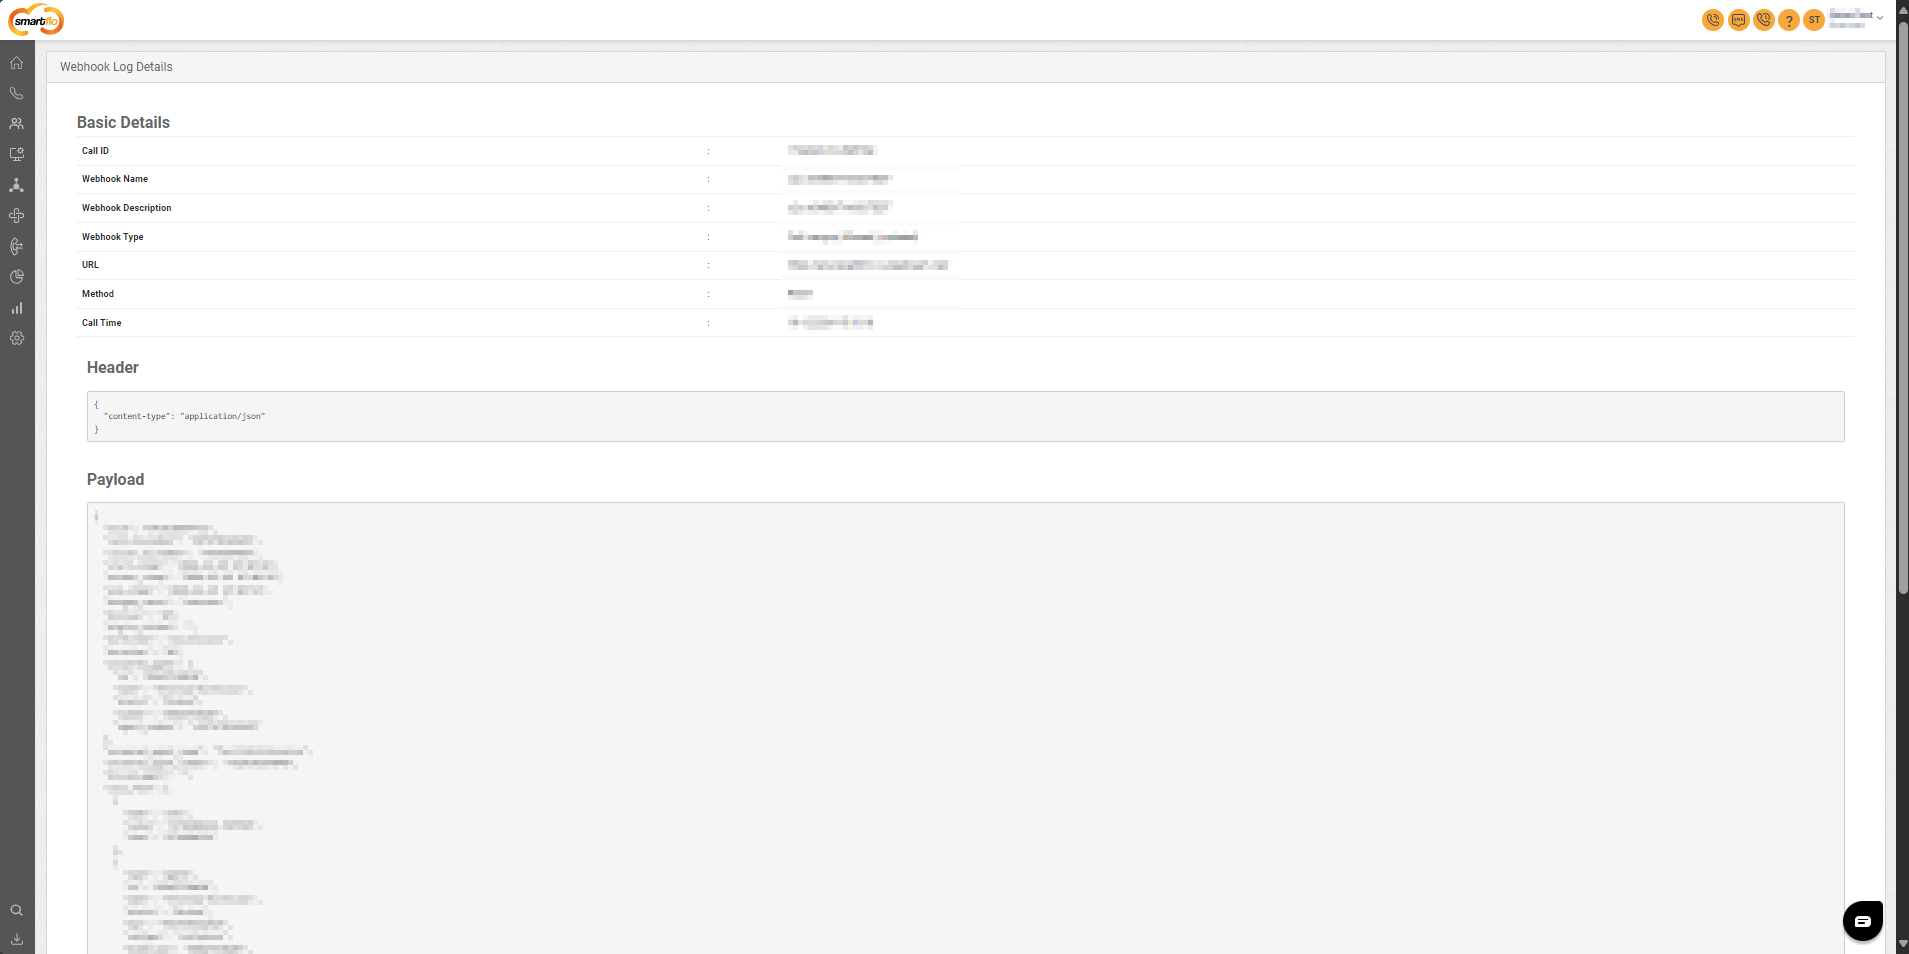
Basic Details Section
| Field | Description |
|---|---|
| Call ID | Unique identifier for the call related to the webhook. |
| Webhook Name | The name of the webhook configured for the system. |
| Webhook Description | A brief description of what the webhook is designed to do. |
| Webhook Type | Type of webhook (e.g., event-triggered or data-push-based). |
| URL | The endpoint URL to which the webhook is sending data. |
| Method | HTTP method used for the request (e.g., GET, POST). |
| Call Time | The timestamp when the webhook call was initiated. |
Header Section
- Displays the headers included in the webhook request.
Payload Section
- The payload contains the data sent in the body of the webhook request. It is usually in JSON format. This section allows you to validate the accuracy of the transmitted data.
Webhook Attempts
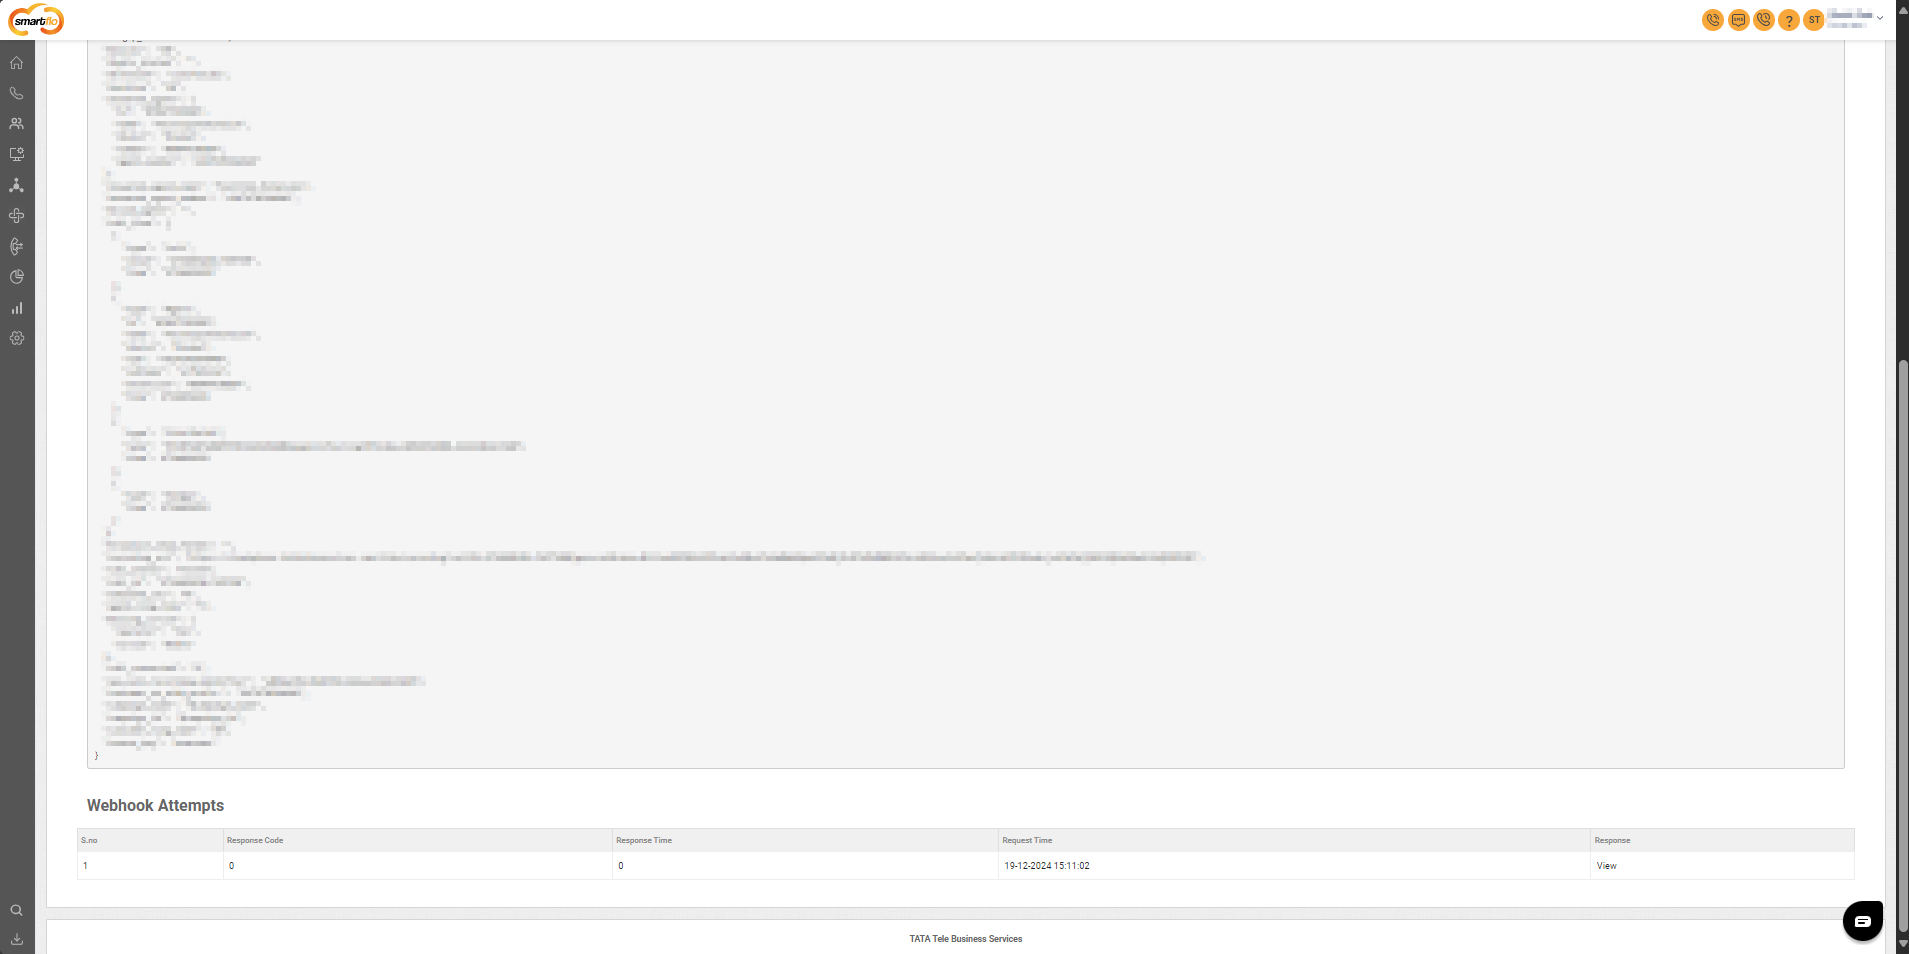
| Field | Description |
|---|---|
| S. No. | Serial number of the attempt. |
| Response Code | HTTP response code received from the endpoint (e.g., 200 for success, 404 for not found). |
| Response Time | Time (in seconds) taken to get a response from the endpoint. |
| Request Time | Timestamp when the webhook request was initiated. |
| Response | Option to view the response data from the endpoint for debugging purposes. |
Updated over 1 year ago