Call Stats
Call Stats Overview
Below is a detailed explanation of the three reporting sections (Agent Reports, Department Reports, and Broadcast Reports) along with their respective metrics.
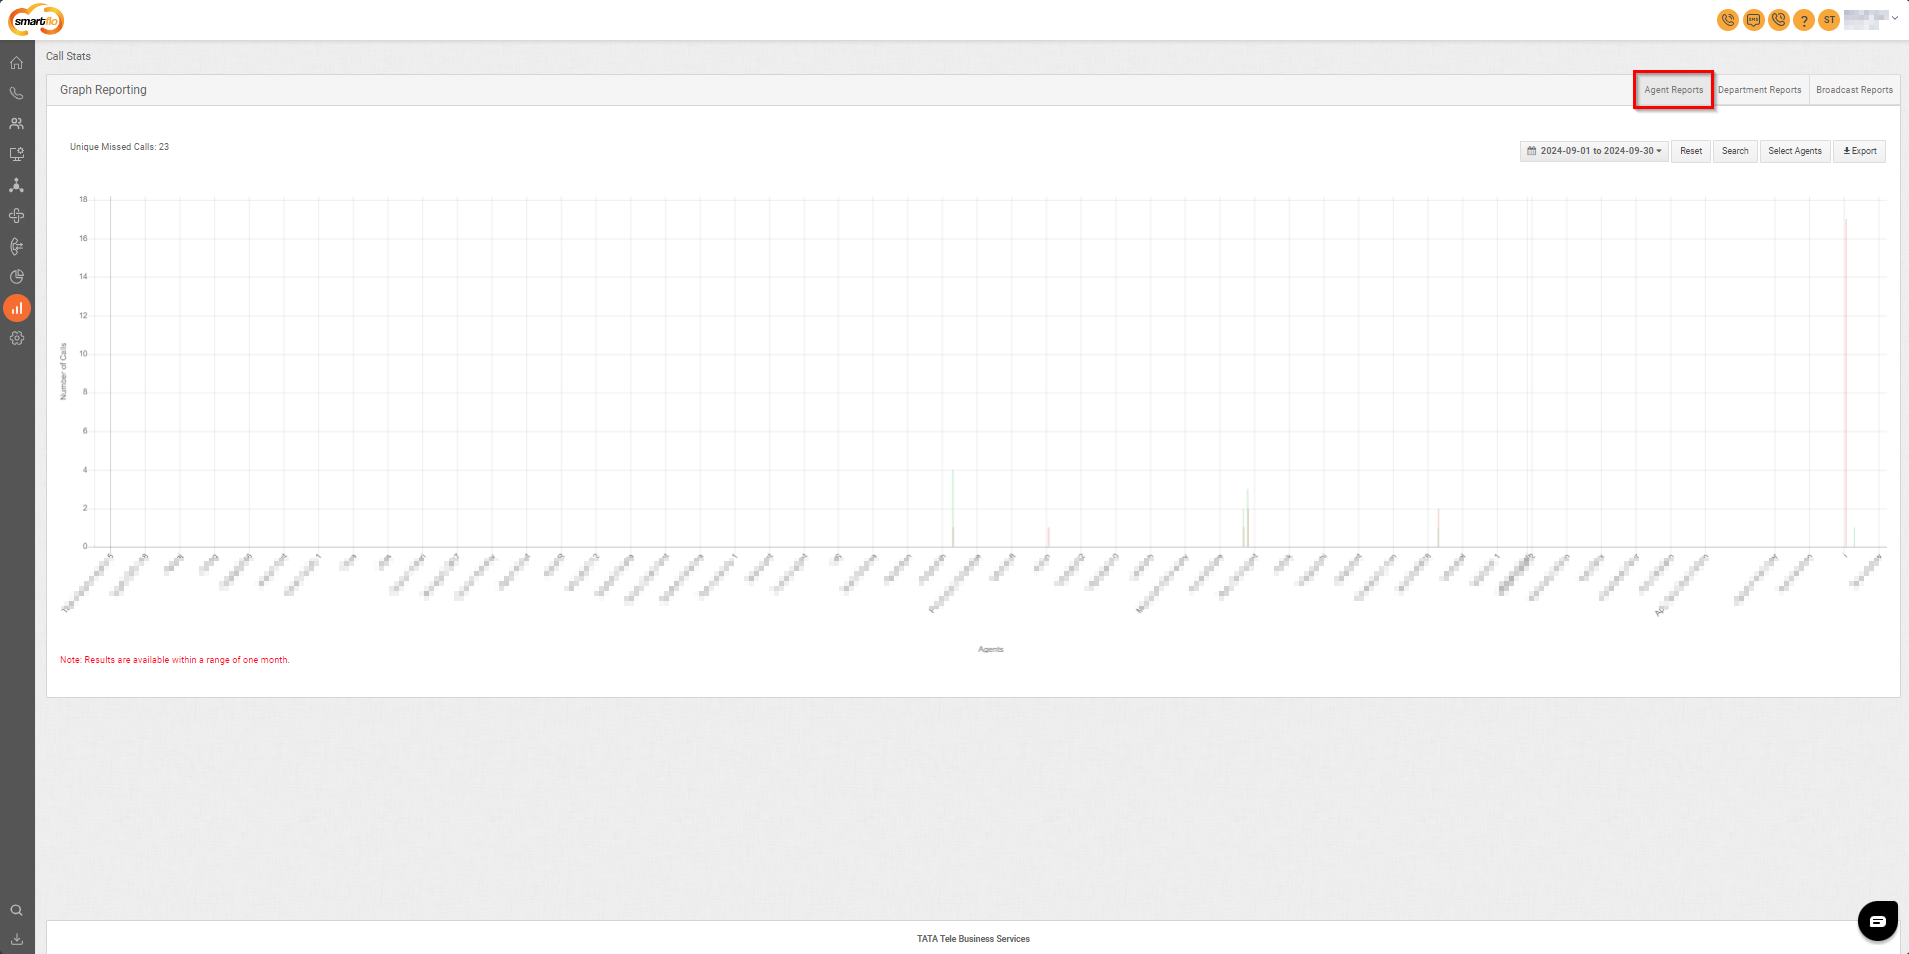
1. Agent Reports
- Focused on tracking individual agent performance, specifically missed and handled calls.
Metrics and Details
- Unique Missed Calls: Total number of calls missed by specific agents during the selected time period.
- Number of Calls (Handled): Shows calls successfully handled by agents.
Agent-wise Breakdown
- Visual representation of agent-wise performance using bar graphs.
- Horizontal Axis: Displays agent names.
- Vertical Axis: Displays the number of missed or handled calls per agent.
Filters
- Date Range: Filter the data within a one-month range.
- Select Agents: Narrow down the analysis to specific agents.
- Export Option: Download the report for external analysis in CSV or Excel format.
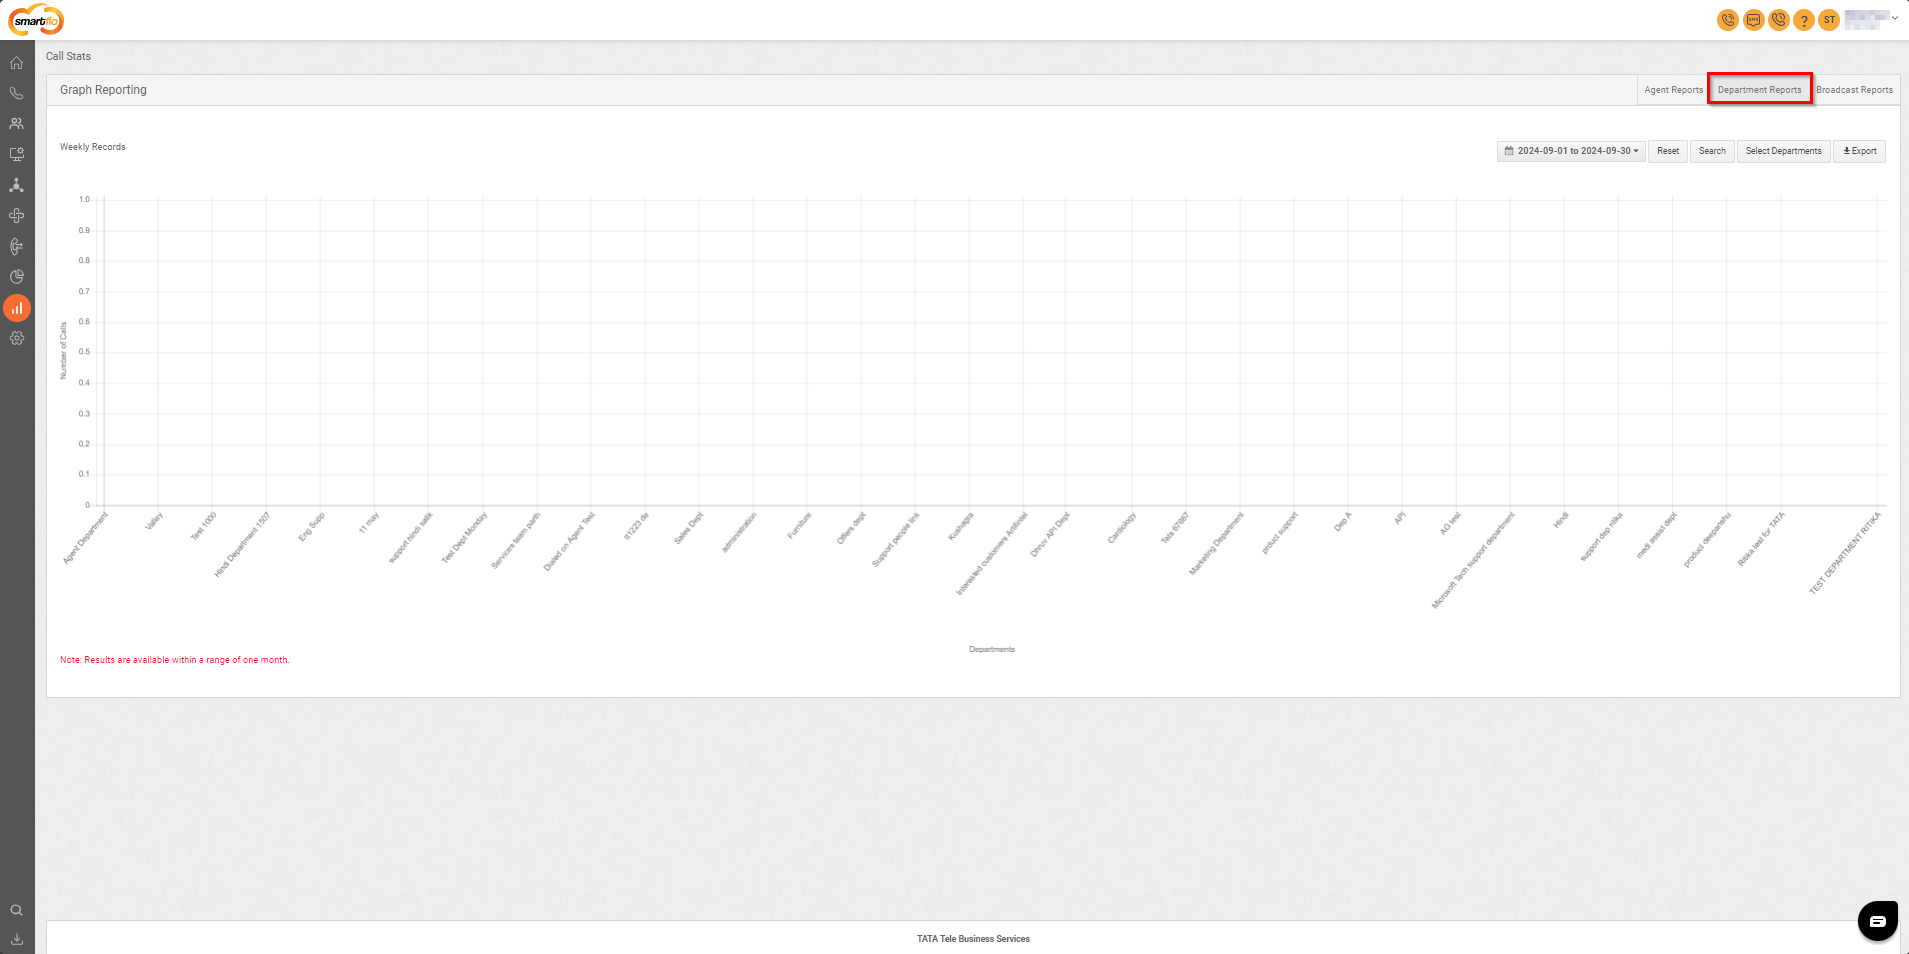
2. Department Reports
Purpose: Provides an overview of call handling and missed calls across various departments.
Metrics and Details
-
Weekly Records:
- Tracks weekly performance metrics for each department.
- Horizontal Axis: Displays department names.
- Vertical Axis: Represents the total number of calls (missed or handled) for the week.
-
Department-Wise Analysis:
- Displays detailed department names and their associated call statistics.
- Highlights missed call percentages and handled call metrics for each department.
Filters
- Date Range: Analyze weekly trends within the one-month time limit.
- Select Departments: Focus analysis on specific departments.
- Export Option: Download department-level performance data for further analysis.
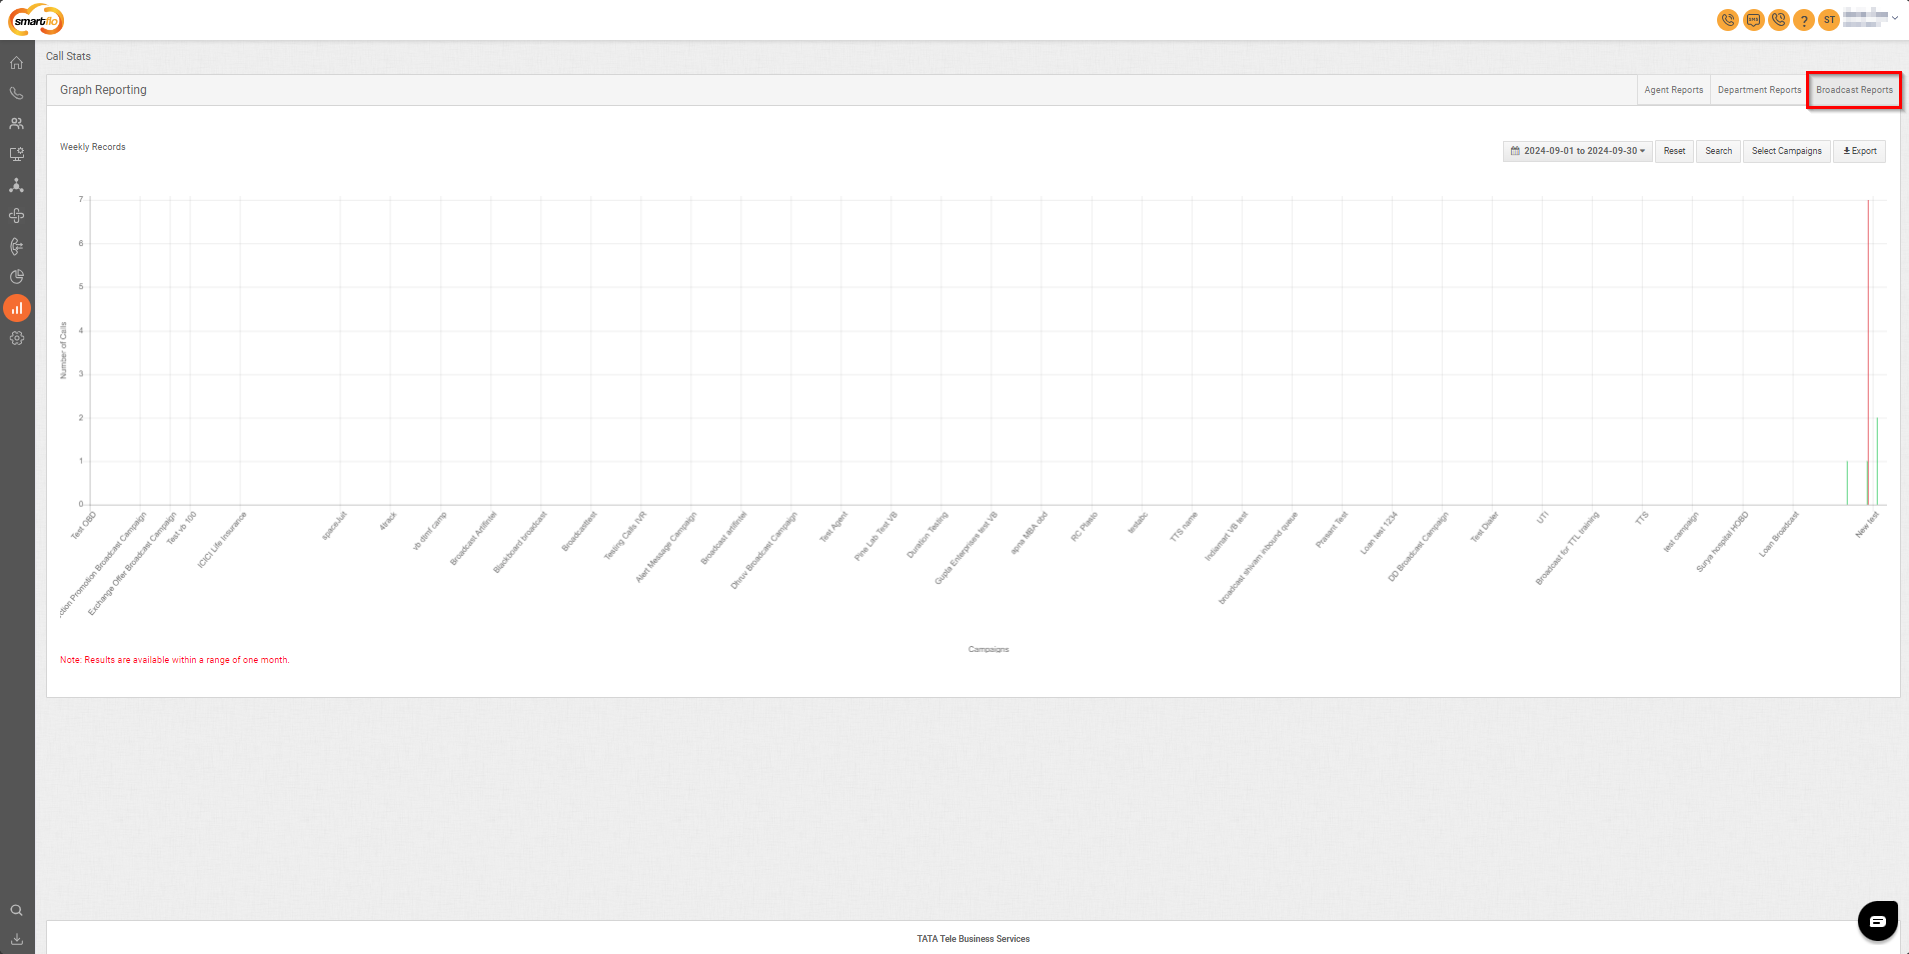
3. Broadcast Reports
Purpose: Monitors performance metrics related to broadcast campaigns.
Metrics and Details
-
Campaign Name:
- Displays all active and completed broadcast campaigns.
- Each campaign is analyzed for its call performance.
-
Metrics:
- Total Calls: Total number of calls initiated through the broadcast campaign.
- Answered Calls: Number of calls successfully answered by recipients.
- Missed Calls: Number of calls missed by recipients.
- Dropped Calls: Calls that were disconnected before being answered.
- Response Time: Average time taken to respond to a broadcast call.
- Talk Time: Average time spent talking during each answered call.
-
Graphical View:
- Horizontal Axis: Displays campaign names.
- Vertical Axis: Showcases the number of calls (answered, missed, or dropped).
Filters
- Date Range: Analyze broadcast data within the one-month window.
- Select Campaigns: Focus analysis on specific campaigns.
- Export Option: Extract campaign performance data for further analysis.
All reports display data within a one-month range to ensure current and actionable insights.